
Can it stay above in the new trading week
The USDJPY spent the last 8 weeks below the 100 and 200 week MAs (blue and green lines in the chart below). Two weeks ago the pair stalled at new year lows - taking out the April 16th week low at 108.12.
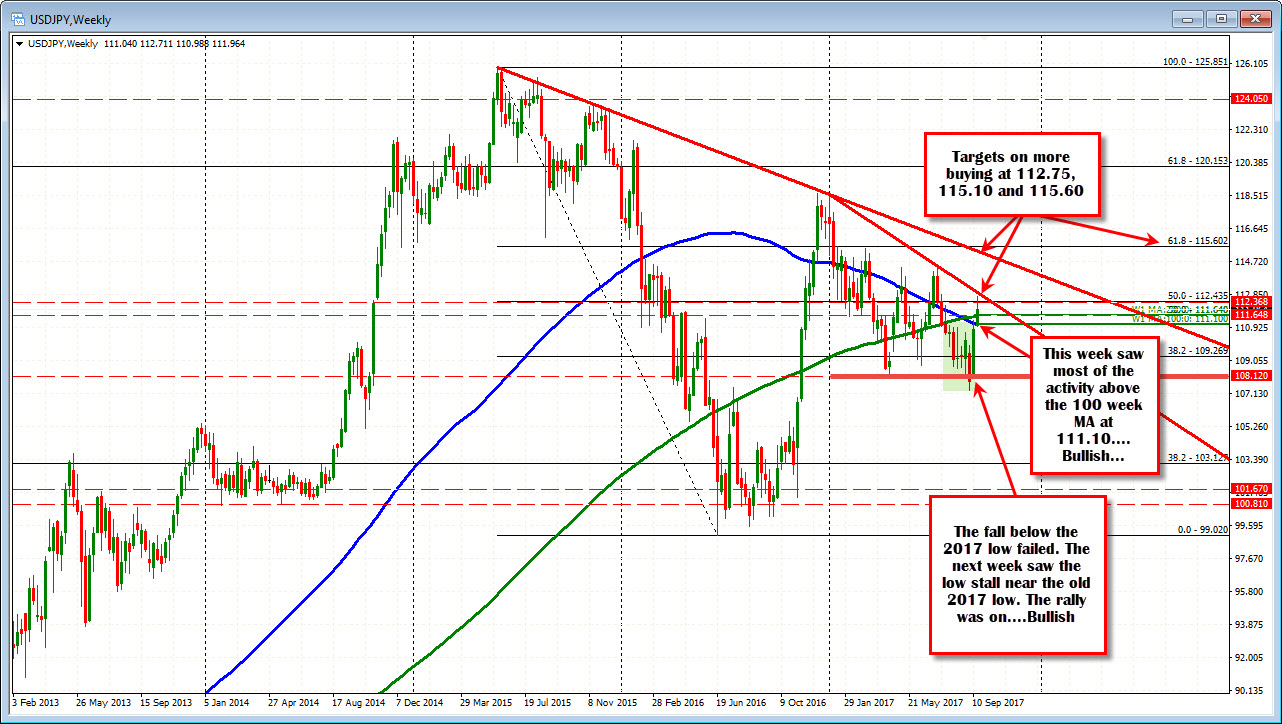
One week ago, the low for the week stalled at 108.09 - just below the old year low - and closed near the high but below the MAs.
This week, the low was 110.99. The 100 week MA was 11 pips above at 111.10. The first 3 hours of the trading week traded below the 100 week MA and on the FOMC day this week, there was a liquidity dip (at least on my chart) that saw the price dip for less than a minute below the level (it might have been spread related), before rocketing higher. That move to the upside took the price above the 200 week MA as well at 111.64.
When a pair moves back above the 100 and 200 bar MA, I pay attention. It turns the technical bias from bearish below to bullish above. But, I want to see those levels hold too. I want to see the price stay above, so that bias can remain bulllish and perhaps get more doubting bulls on the bandwagon.
For those who bought the break, they too have a vested interest in seeing the level become support. In the new trading week, staying above the 200 week MA at 111.64 is the most bullish scenario for the bulls/buyers. For those willing to give a little more room the 100 week MA will be eyed as the firm line in the sand on a dip. Go below 200 and 100 week MAs would switch the bias back to the downside. Bullish idea is thrown out the trading window.
With that perspective, I drill down to the hourly chart, and look at what happened (see chart below).
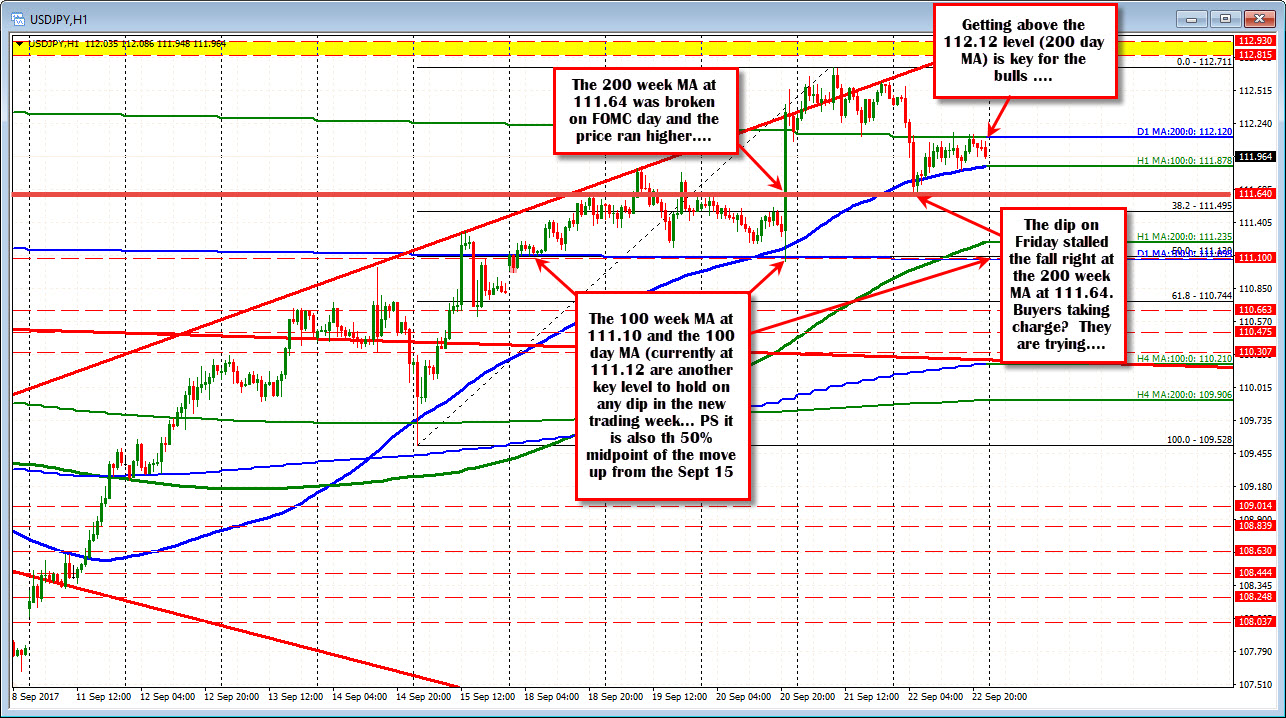
Friday was a down day for the USDJPY. The sharp gains on FOMC day were retraced. The major dip came on the rhetoric from N. Korea. The USDJPY still seems to react with JPY buying (USDJPY selling) on news out of that region.
The selling took the pair back below the 200 day MA at 112.12 (see green line marked D1 MA:200) and briefly below the 100 hour MA too (blue smooth line currently at 111.878).
However, note where the fall stalled? At 111.647. That is right at that 200 week MA level.
Buyers went to the edge of the key support. Looked over. Put their bid in and stalled the fall.
Now the buyers are not out of the woods. The high price off the Friday low, stalled near that 200 day MA at 112.12 and getting above that level will be a key step for the bulls in the new trading week. However, the battle lines are drawn.
- On the downside stay above the 200 week MA at 111.64 (and worst case above the 100 week MA at 111.10). That is the risk for the longs.
- On the topside get and stay above the 200 day MA.
Breaks higher will look to get above trend lines on the weekly at 112.75 area and then 115.10. The 61.8% of the move down from the 2015 high comes in at 115.60.
If the 200 week MA and 100 week MA are broken to the downside, retracing from whence the pair has come over the last few weeks begins (PS the 100 day MA and the 100 week MA are virtually at the same level of 111.10. Key level.
SUMMARY: After 8 weeks below both the 100 and 200 week MAs, the price moved and closed above each of those moving averages. That action turned the bias from more bearish to more bullish.
Moreover, the price also moved above and away from the 100 day MA (at the same level of the 100 week MA at 111.10 area) AND held the 200 week MA on a correction on Friday at 111.64. Bullish.
If the pair is going to continued the bullish run, those levels HAVE to hold support. Failure and his idea of a break to more bullish is a failure too.
To help confirm the bullishness, a move back above the 200 day MA at 112.12 will be eyed. Get above and stay above, and the road higher can continue.

