
100 bar MA on the 4-hour chart broken and stops triggered.
The EURUSD stalled at the 100 bar MA on the 4-hour chart earlier and bounced. The bounce took the price from 1.1780 to 1.1795 but the next test of the MA led to a break and stops. The price has run from 1.17808 (100 bar MA on the 4-hour) to a low of 1.17653.
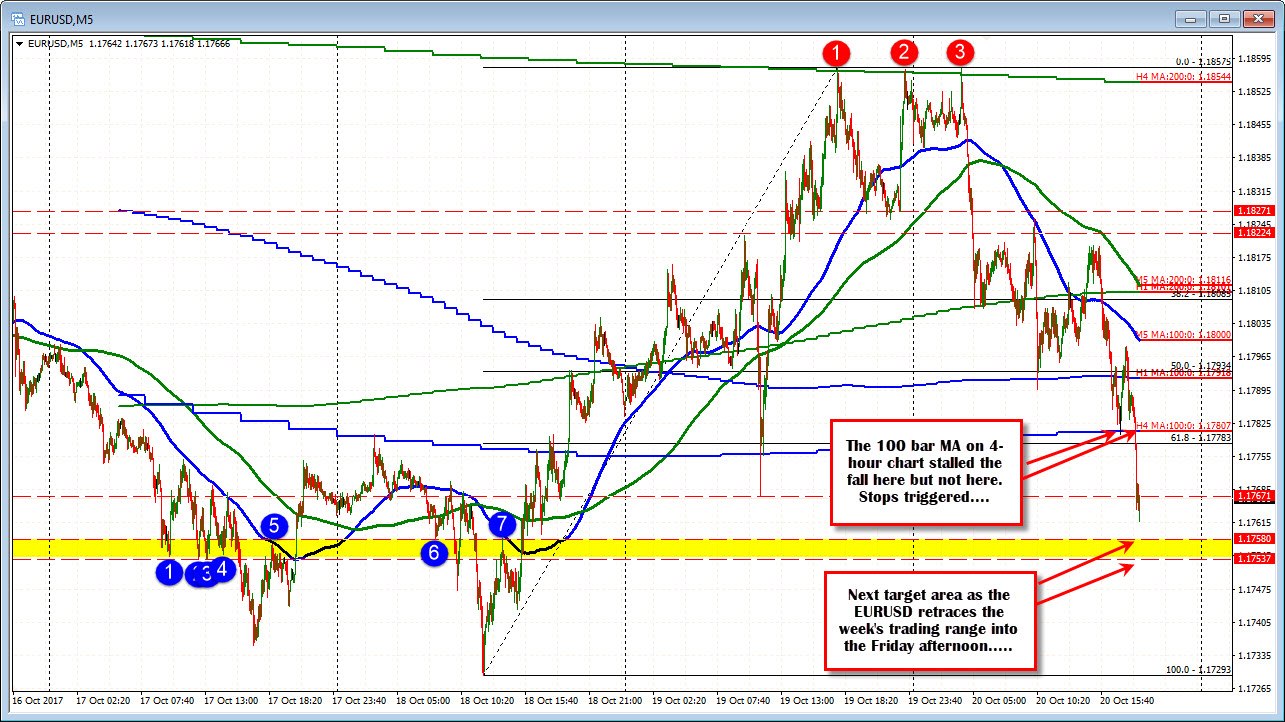
The MA line is now resistance.
It is Friday afternoon now. London traders are exiting for the week.
For the week, the 200 bar MA on the 4-hour chart was the clear ceiling (see red circles 1, 2 and 3). The price stalled against the level three times.
The 1.17537-58 is a level to eye ahead of the low for the week.
Taking a broader view from the 4-hour chart below, last week, the 50% of the move down from the September high stalled the rally. The 200 bar MA on the 4-hour chart was also near high. Finally the high last week was within 3 pips of the June 2010 swing low. That was a key level.
This week - as outlined above - the same 200 bar MA held the rally three times. It was lower than last week, which makes the selllers look more anxious. Bearish.
Now the 100 bar MA break is showing sellers are going to a new level. Can it stay below? It is Friday and the market may waffle around. However, in next weeks trading, we will look to see if the "market" can keep the pressure on. If so, The 1.1716-20 will be eyed first, followed by October lows.
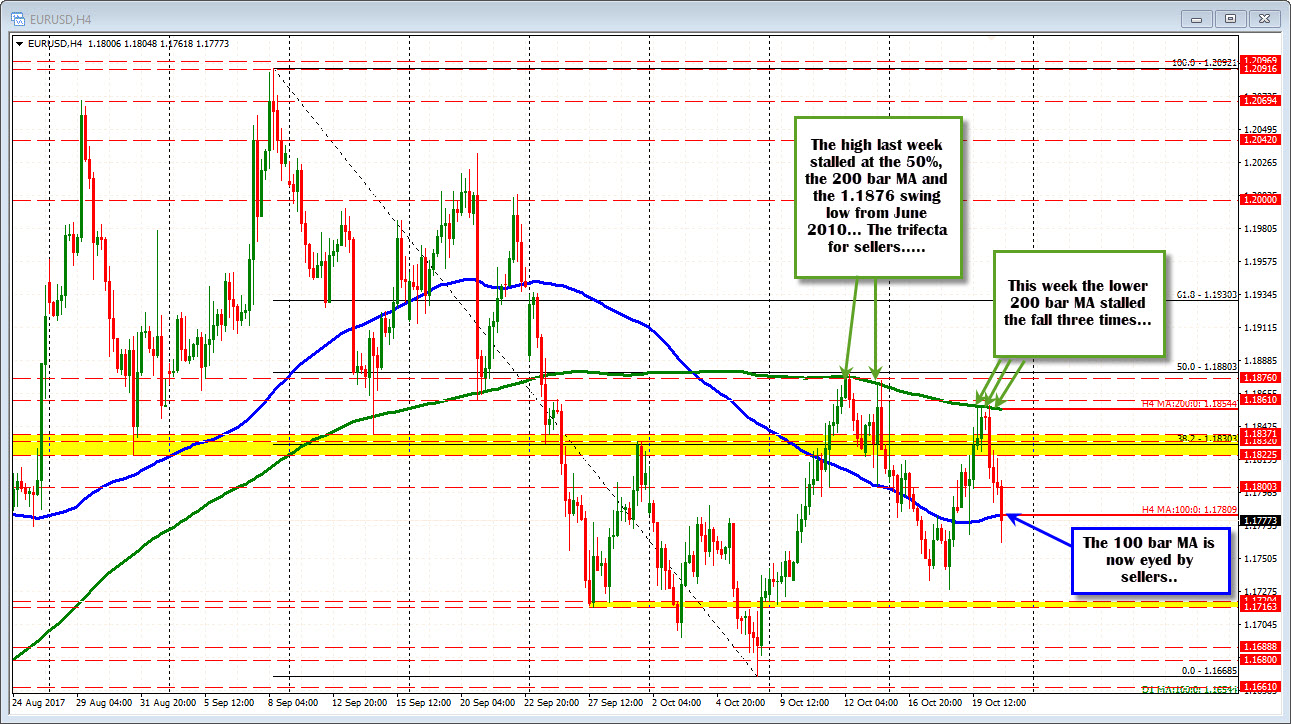
We will see how aggressive the sellers want to be by listening to the price action.

