
EUR/USD Forex technical analysis
Last Thursday I noted that if we fell low enough we'd find decent support around 1.1120. Well, here we are at 1.1115/20 trying to stop what could be a decent blow out through 1.1100
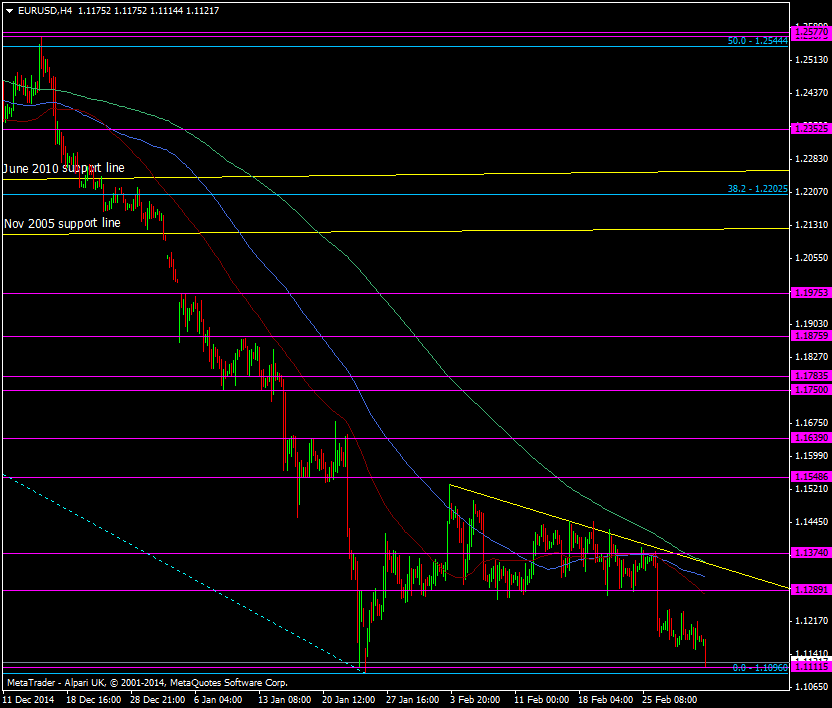
EUR/USD H4 chart
At any other time this could be a good opportunity to test for a double bottom at these levels but with the ECB tomorrow it throws that sideways somewhat. The level could still be good to chance a small long from but I'd keep it very tight, probably with a stop on a break of 1.1080/75.
If we do break through here there might be enough in the tank to cruise through 1.1100, and there's not a lot of tech support until at least 1.1020/40, 1.1000 and then 1.0980
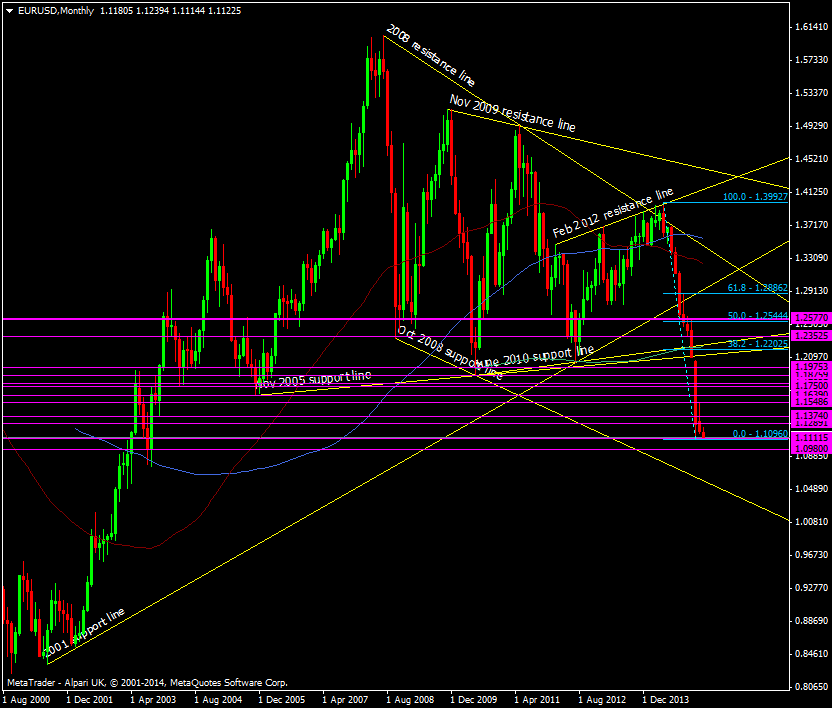
EUR/USD monthly chart
1.1140/45 is your resistance up top, followed by 1.1160/70, 1.1185/90 and 1.1200/10

