
AUDUSD technical analysis
The AUDUSD - like many of the other currency pairs - are seeing steady selling. In the move to the downside, the price has pierced the 100 hour moving average (blue line in the chart below) at the 0.7833 level currently, and the 200 hour moving average (green line in the chart below), at 0.7816 currently. These levels are now risk for shorts looking for lower levels in the pair.
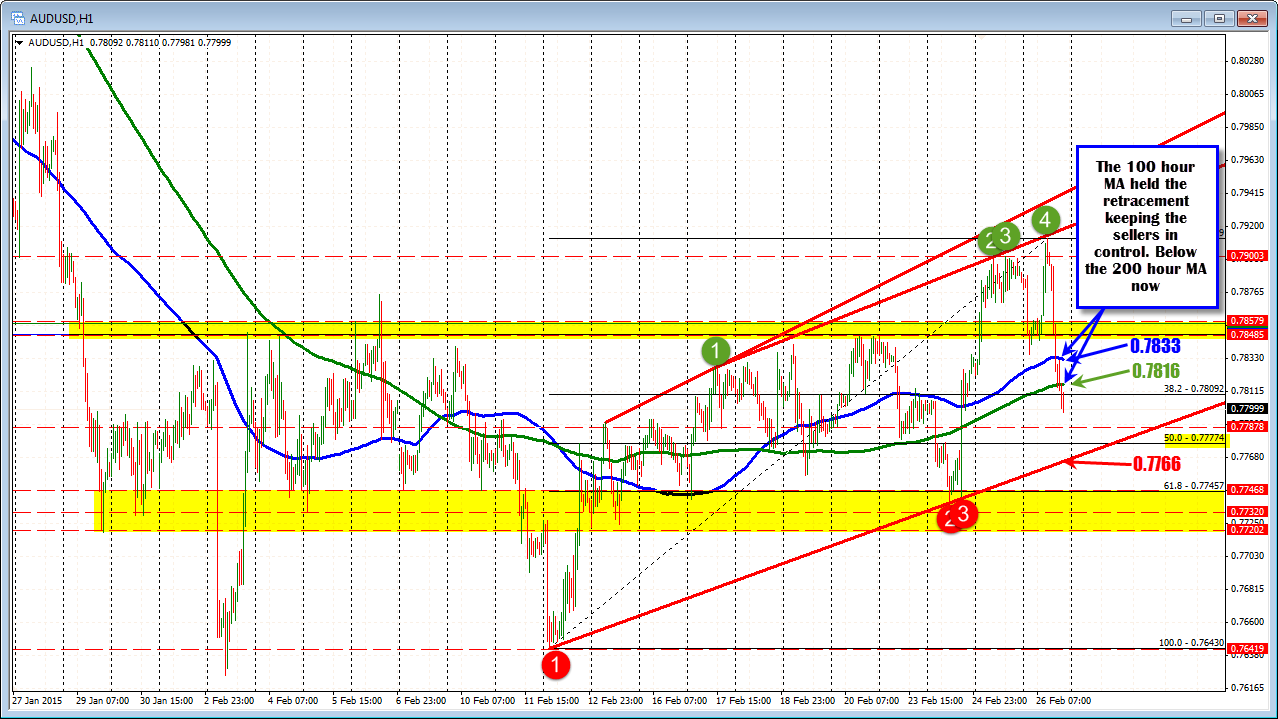
On the downside the next major targets come in at the 0.77774 level. This is the 50% retracement of the move up from the February 12 low. Below that trend line support comes in at 0.7766 (see hourly chart above).
The AUDUSD tried to extend to the upside in trading yesterday and again today. The move above the top yellow area between 0.7848 and 0.7858, should have solicited a more bullish bias for the pair on the breakout. However, the topside trend line (see green circled numbers) stalled the rally. The dollar buying in the New York session helped solidify the change in the bias for traders. The current price is back in the belly of the area where the vast majority of the trading has taken place since January 29 (in between the yellow extremes..
With the price now below the 200 and 100 hour moving averages, staying below those moving averages should give the sellers the confidence to head back down and test the lower yellow area where a bunch of swing lows found support. Is there a huge shift for the pair? If you were to erase the two moves above the top side yellow area, and the two earlier moves below the lower yellow area, the pair is near the middle of a 0.7720 and 0.7858 range. Buy low and sell high. Look for a break of the extremes. Use the MAs as bullish or bearish bias in between. .

