
May 2016 high 1.16156. The low today dipped to 1.1612 before bouncing.
The EURUSD dipped to the broken May 2016 high at 1.16156 in trading today.
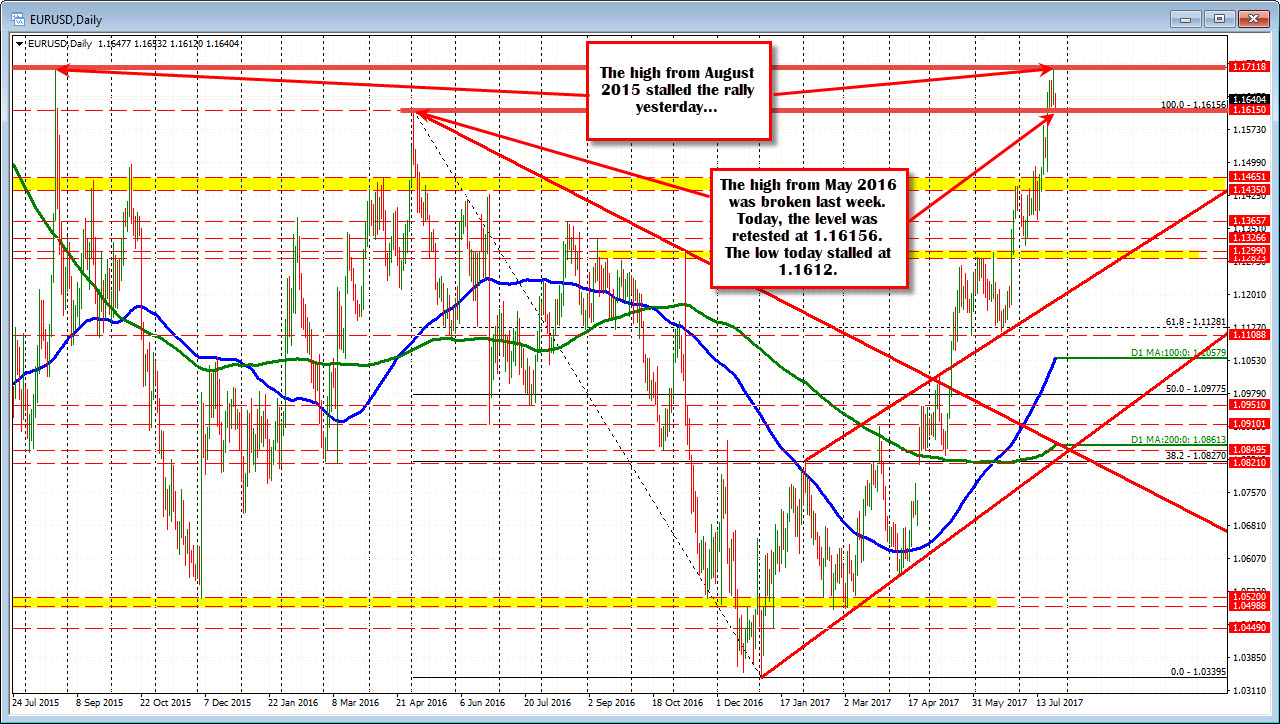
Since the break on Thursday last week, the price has remained above that level (well almost. More on that below). Yesterday, the pair moved right up to the next key target at 1.1711. That level corresponded with the August 2015 high. It hit the level (high reached 1.17117) and came right back down. The buyers turned to sellers on profit taking/new sales against the risk defining level.
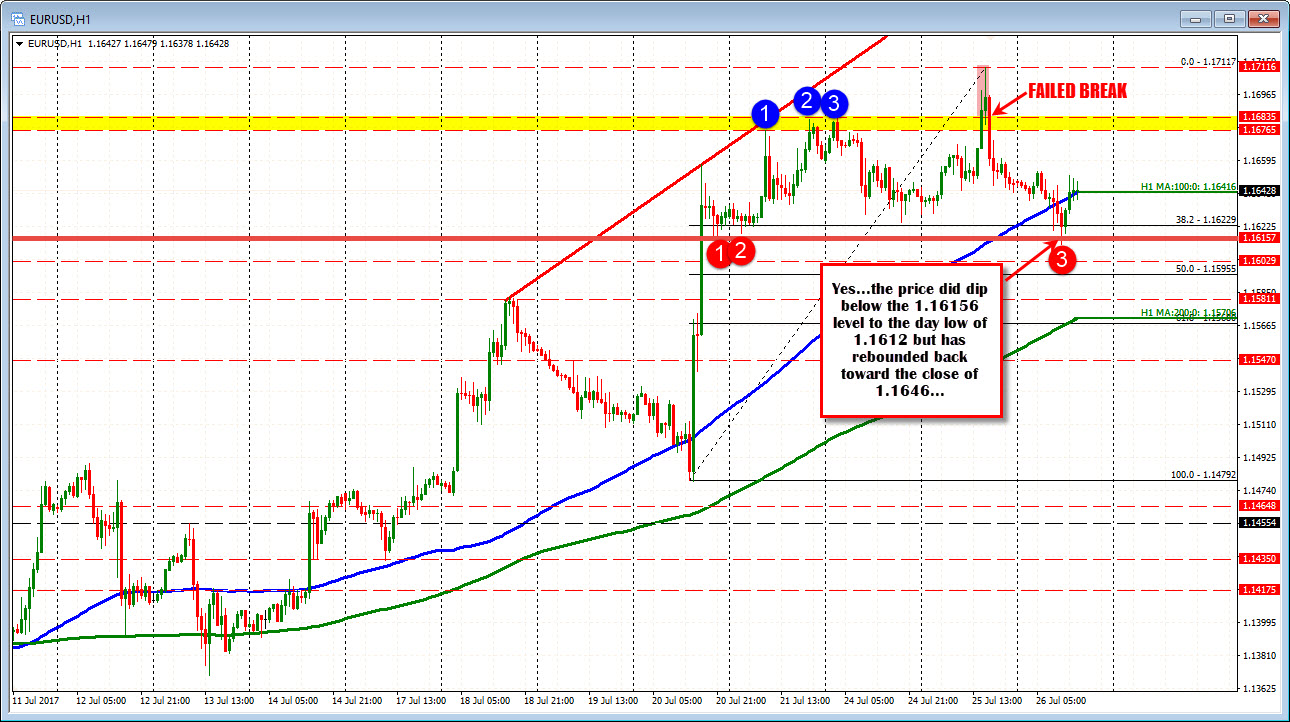
Today, the correction lower continued and indeed, we have seen a small look below the aforementioned 1.16156 level. The low today reached 1.1612 before moving back higher. We currently trade back near the closing level from yesterday's trading at 1.1646
We have the FOMC later today. The resistance target held yesterday at 1.1711. The support target held today at 1.16156 (give or take 3 pips). The range is defined. We trade near the middle of the range (maybe a little more toward the low). Traders will take their clues from the Fed (do they announce QE taper?), as well as the price action. The "market" will be looking for breaks of the extremes.
Is there a narrower range?
Looking at the hourly chart, the 1.16765 to 1.16835 is some closer resistance (see hourly chart). The highs from July 21 and July 24th stalled at that area. The price moved above it yesterday on the journey to the 1.1711 high. Then fell back below the level. A move above that is more bullish and traders go for the 2nd run at 1.1711.
If the 1.1615 level is broken (before or after the FOMC decision), the 50% of the move up the July 20 low comes in at 1.1595. Below that the high from July 18 and 200 hour MA at 1.1572-81 be eyed (see levels on hourly chart above).

