Another time consuming battle to fight.
With Article 50 officially signed and presented, it opens up another time consuming can of worms for the EU. In the face of it all, they have to kinda hope a key trading partner is not successful on their own as it will only encourage others to potentially follow suit. Anyway, it will be a long drawn out ordeal - kinda like what we have seen with Greece (and continue to see with Greece). It will take a lot of time and resources and meetings and meetings and comments and comments. You know how they all like a headline and a meeting.
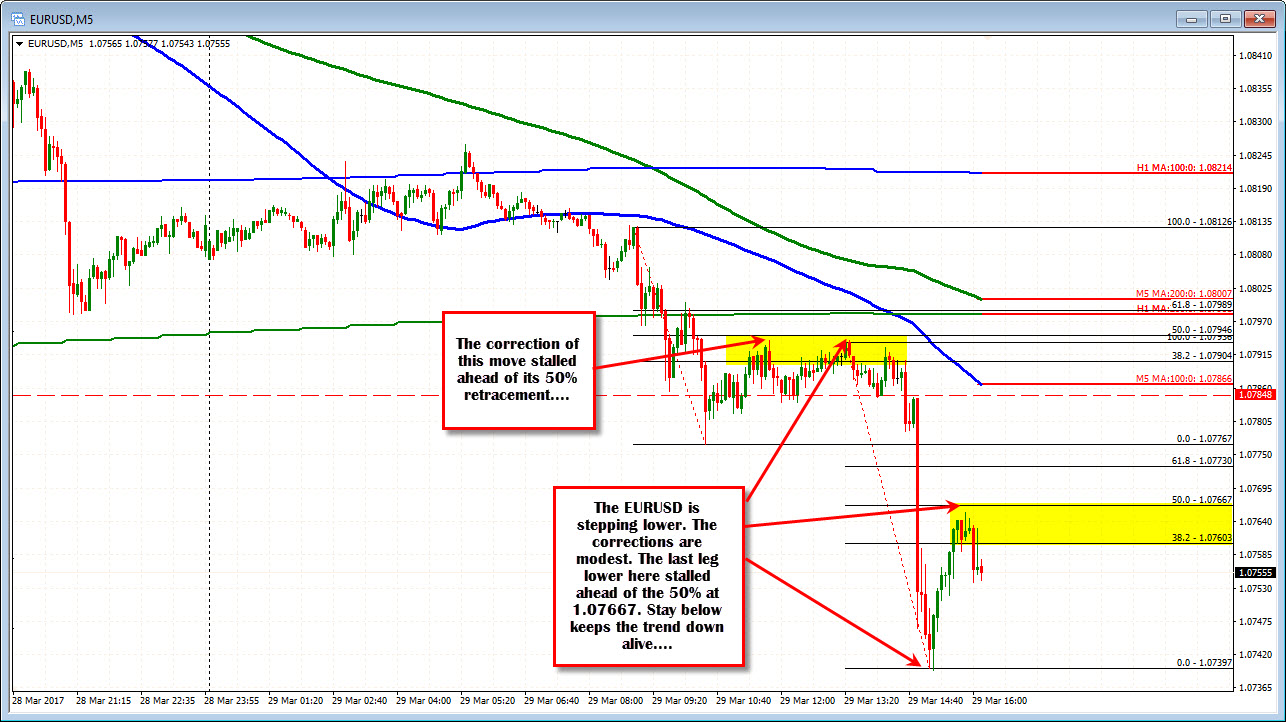
Anyway, technically the EURUSD has not taken the news all that well today. Looking at the 5 minute chart above, the price has stepped down, with sellers near the 100 hour MA in the Asian session (at 1.0821). That led to a move below the 100 bar MA (blue smooth line). The pair has stepped down from there with two legs, followed by modest corrections. The corrections have stalled between the 38.2%-50% of the legs down (see yellow areas). That is showing sellers are more in control. Close risk for sellers now is the 1.07667 level. Stay below is more bearish. Move above and the trend move lower idea gets muddy. It should lead to more balanced trading.
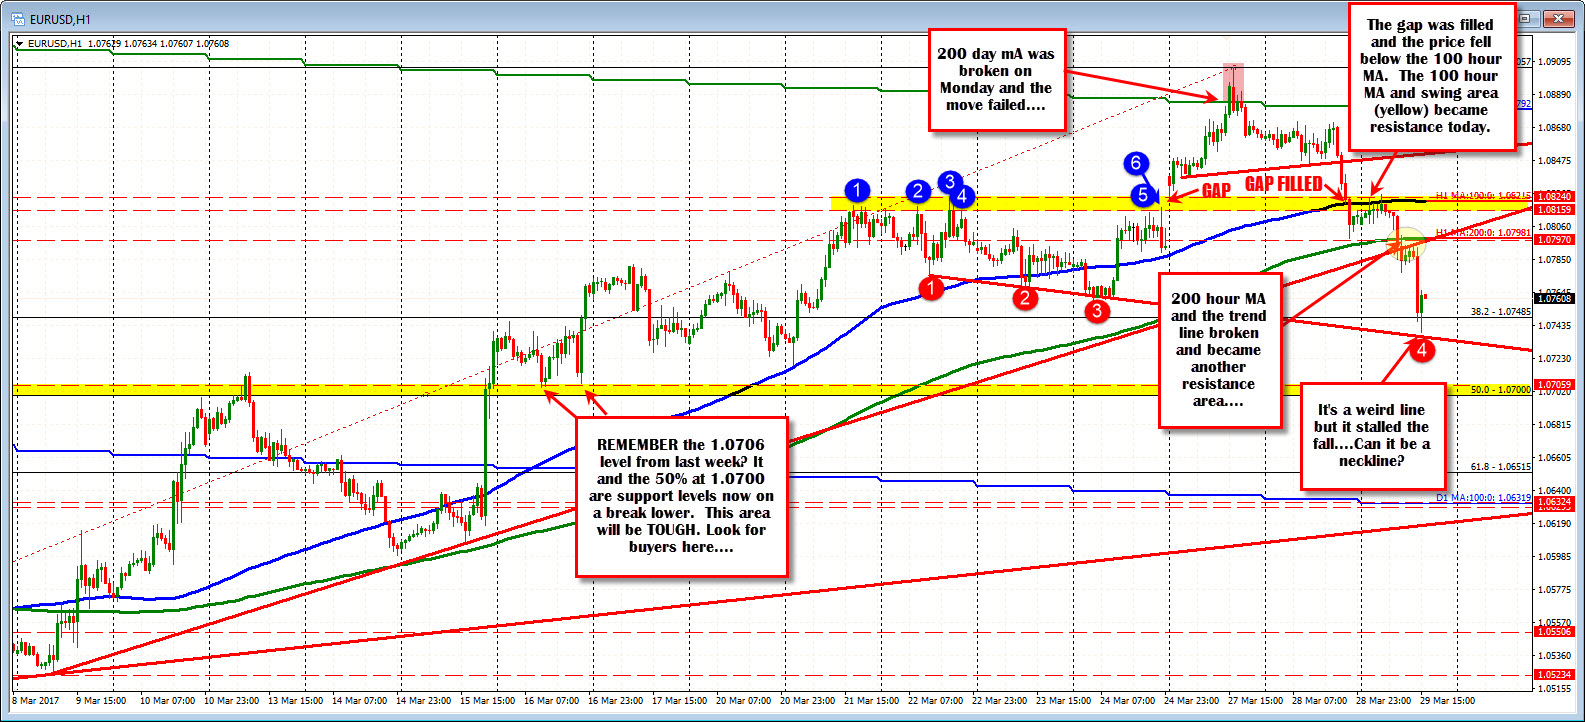
Looking at the hourly chart, the price action this week started with a gap move higher followed by a move above the 200 day MA. That break FAILED and it started the fall through technical levels one by one. .
Yesterday, the price fell below trend line, filled the gap between 1.0817-24, and fell below the 100 hour MA (solid blue line). That break led to a period where the price traded between the 200 hour MA (solid green line) and the 100 hour MA at the end of the NY session and into the Asian session today.
Today the price fell below the 200 hour MA and trend line extending back to March 9th and created another leg lower. The low today stalled against a downward sloping trend line connecting bottoms. We are trading above and below the 38.2% of the move up from the March low at 1.07485 as buyers and sellers battle.
Overall, the action on the 5-minute and hourly charts suggest sellers remain in control (watch the 50% on 5- minute at 1.0766 as close risk). However, the price needs to get below the lower trend line on the hourly to get sellers even more committed.
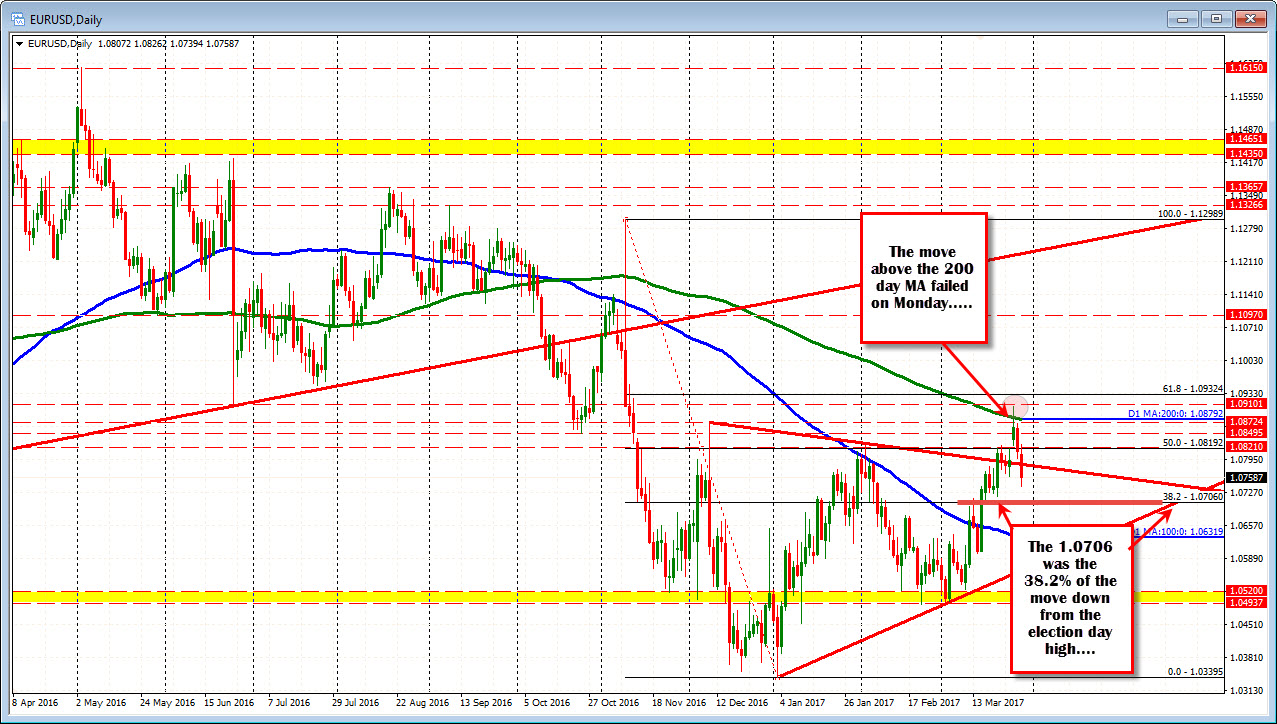
Having said that, on a break lower, we need to remember the 1.0706 level from last week (see daily chart below). That level and the 50% of the March trading range at 1.0700 (see hourly chart above) will be TOUGH support level to break. Look for buyers on a dip there.