Resistance holds on the 1st test
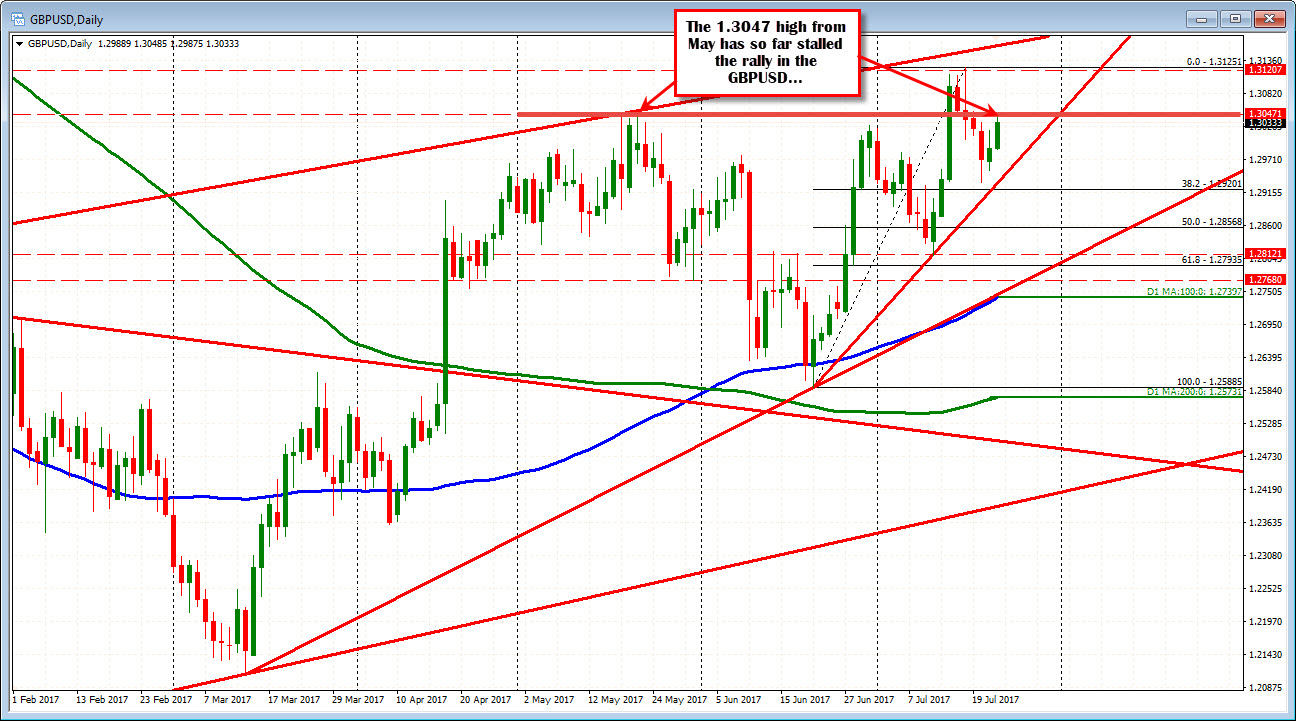
The GBPUSD stalled at the May 2017 high in the London morning session. That high in May came in at 1.30471. The high today reached 1.3048. Close enough.
The current price is trading at 1.3034. That is up from the Friday close of 1.2989. Technically, the 1.3047 level represents a topside resistance level. A move above opens the door for another test of the highs from last week at 1.3125. So far, however, the sellers have come in at the level and are trying to put a lid on the corrective move.
The move higher today continued the upside move started on Friday. The prior 4 days of the week (Monday to Thursday), saw the GBPUSD move lower each day. So there is a battle going on.
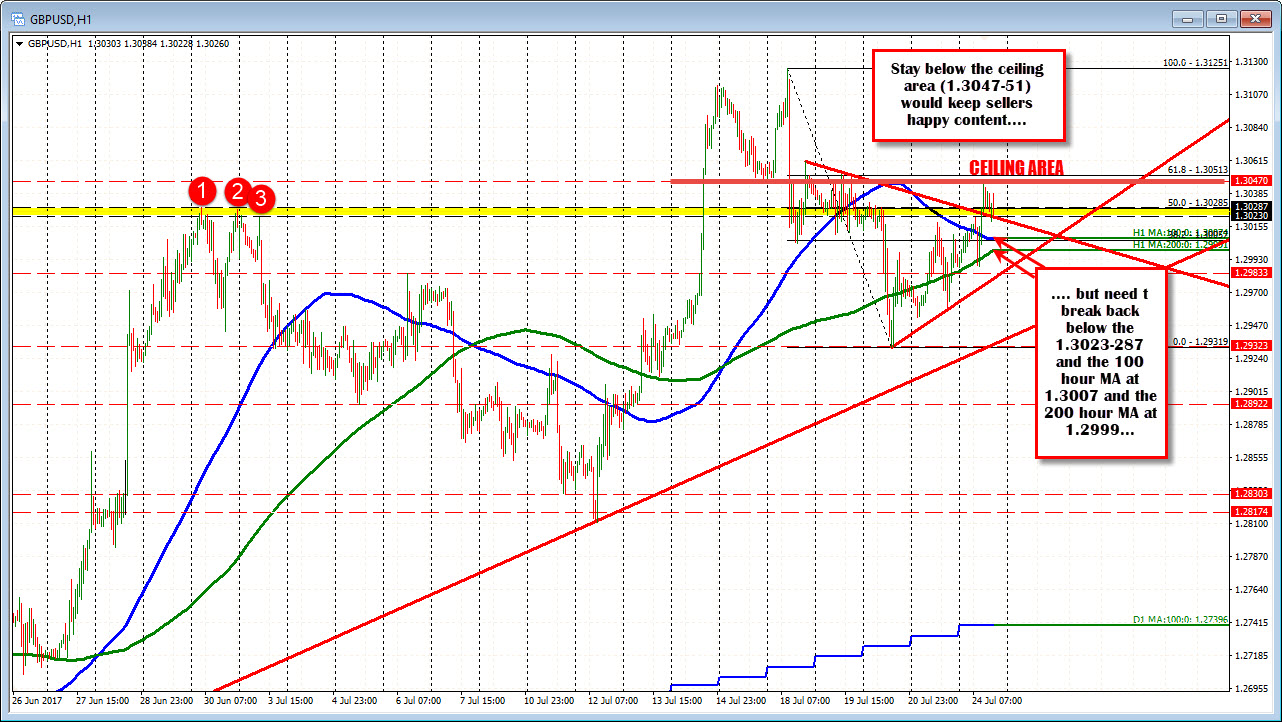
Drilling to the hourly chart below, getting back below the 1.3023-28 area (yellow area in the chart below), and then the 100 and 200 hour MAs at 1.3007 and 1.2999 levels (blue and green lines in the chart below), should solicit more of a downward bias once again. Note that the London low from earlier today, stalled near the 200 hour MA level (green line). That hold, makes the level more important going forward.