Trades at the lowest level since September 8th 2016
The USDCAD this week has not done a lot, but perhaps it is what the pair did not do technically, which is most important.
The range for the week is only 128 pips. That is not a lot. However, the pair does trade near the low for the week and at the lowest level since September 8th 2016. So the small range has still led to a lower level.
When you trade at low extremes (we are trading at the lowest level in 10 months), the burden of proof is on the counter trend traders (in this case the buyers) to show they can take back control. Has the buyers been able to take control this week? Not really. The sellers are still in control.
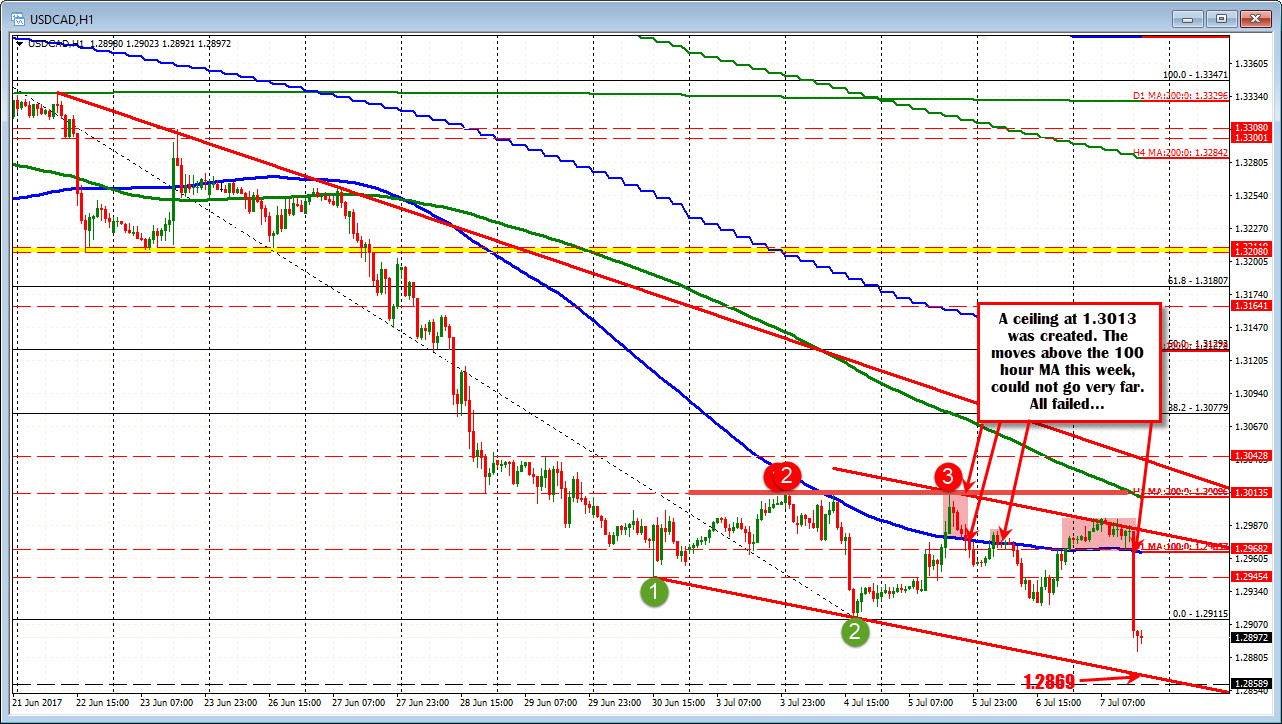
Now the buyers did try. I will give them partial credit. The effort was on the moves above the 100 hour MA (blue line in the chart above).
The last three trading days has seen moves above the 100 hour MA (it is currently at 1.2968), However, each move failed (note on Tuesday the 100 hour MA stalled the rally). Moreover, the breaks of the 100 hour MA could not get to the 1.3013 ceiling created from the Monday, Tuesday and Wednesday's highs.
Going forward, keep the 100 hour MA and the 1.3013 level in your "traders memory bank" now that the price has moved away. They represent resistance levels on any corrective move. The levels should attract sellers against them on tests. If the price moves above, that would tell a different technical story. The buyers would be taking back more control.
On the downside, the 1.2869 level is the lower trend line connecting lows from this week.
What does the daily chart say?
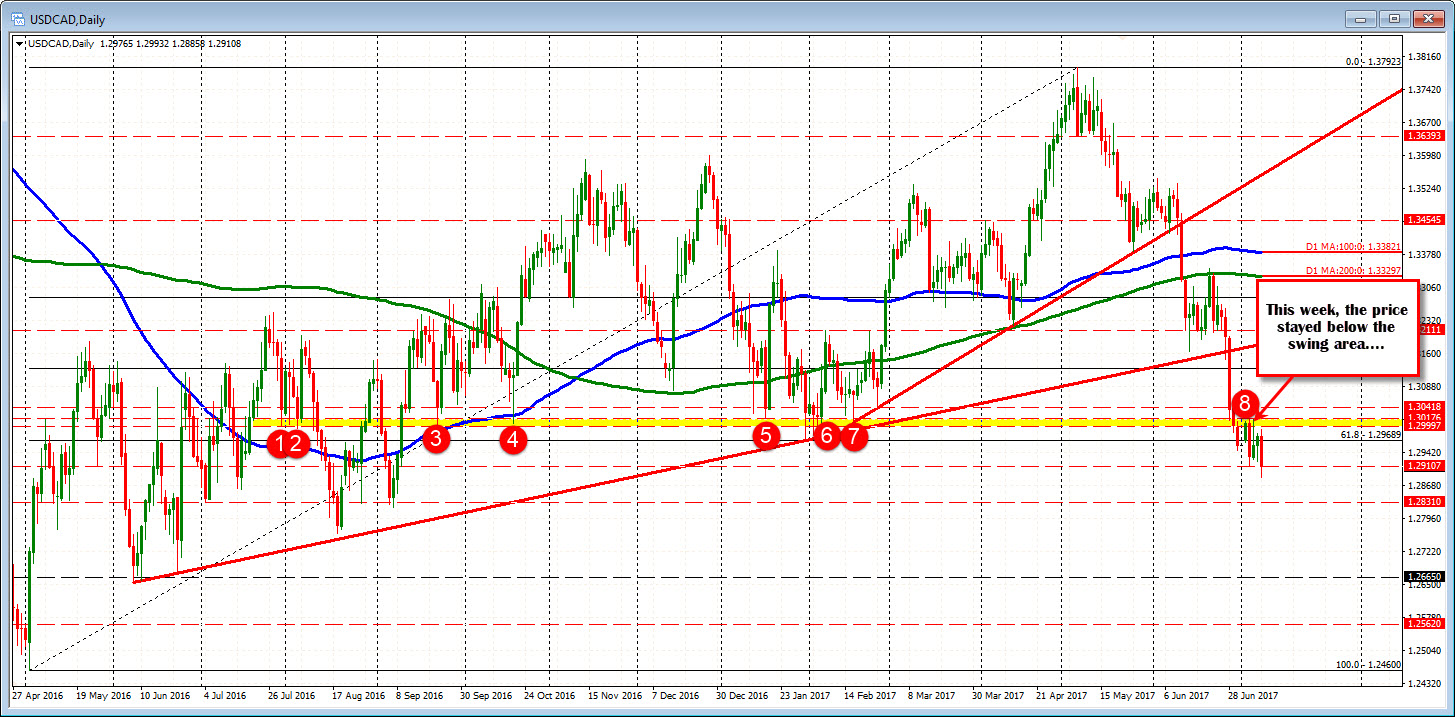
Looking at the daily chart, the 1.3000 to 1.3017 level has been home to a number of swing levels over the last year. This week the price stayed below that area with a high at 1.3013. Sellers winning. The daily chart still says lower.
So although the pair has not done a whole lot from a pip standpoint, the buyers failed. The sellers prevailed, and lid above has gotten stronger.