
Muddies the water technically
The GBPUSD support area gave way in the GBPUSD and with it, the buyers turned to sellers (see prior post). From a technical perspective, the picture is now more muddy.
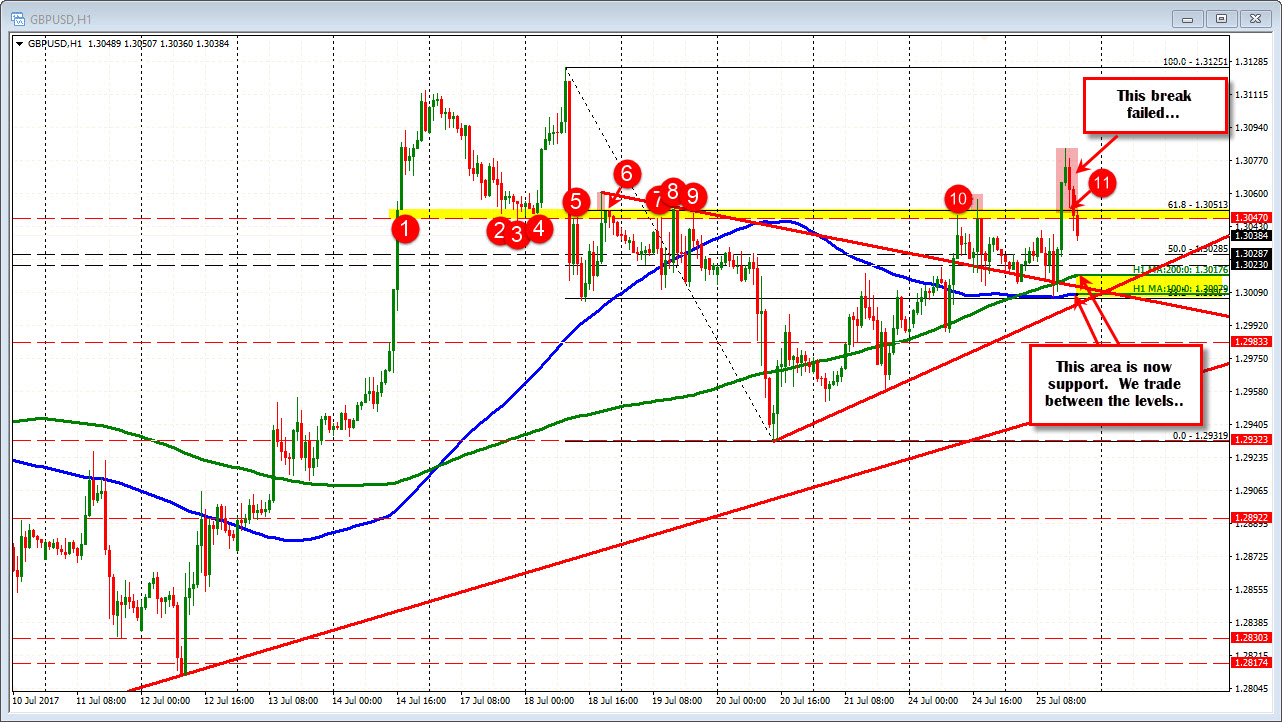
Why?
On the bullish side, the pair held the 100 hour MA at the day lows.
On the bearish side, the pair failed to hold above the 1.3047-52 area (and moved below the days midpoint at 1.30452 as well).
So muddy it is. What does that mean for trading?
"Muddy" suggests the market is unsure and so am I. So risk on trades (if you decide to get involved with a new position) should be limited. Also watch the targets if they trade does go your way. Muddy can lead to trading a range (or even have more failures on "breaks".
The last failure was on the break above the 1.3052 area. That level should set a ceiling again. If the 1.3052 level is re-broken, traders will be scratching heads even harder, but technically it would look better (more bullish...sort of).
On the downside, the 200 hour MA (green line) and 100 hour MA (blue line) will be in play as key targets below. If the price does head lower, a break below those MA levels should solicit more selling.
As Adam points out, there are some potential lifelines that may save the dollar (and send the GBPUSD pair lower).
The waters are muddy. The market tried lower. It tried higher. It can go either way from here. So trade against levels if you must and follow targets. Alternatively, you can also sit to the side and wait for a better time/day.

