
Tumble takes the price to the 50% and toward 200 hour MA
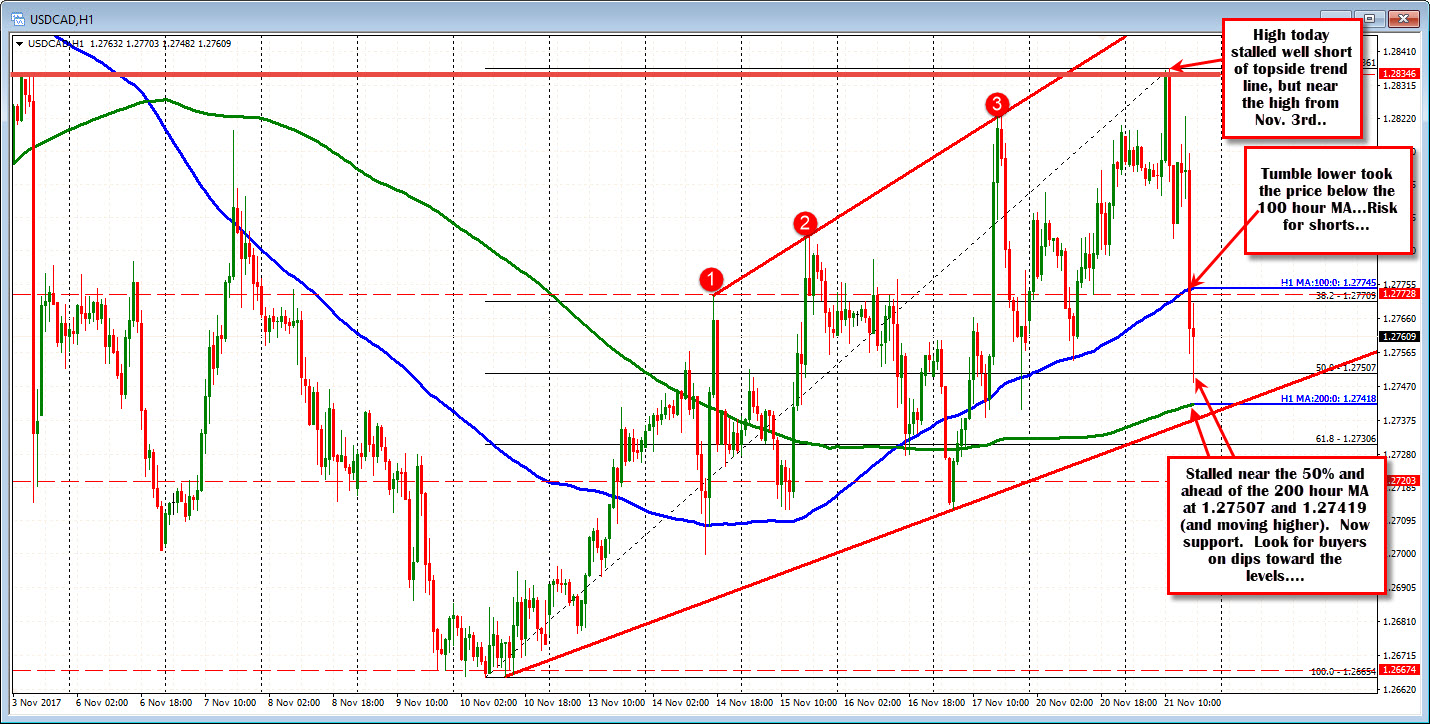
The USDCAD traded to the swing high from November 3rd at 1.28346 and stalled. That started a rotation lower, and turned the buyers to sellers.
The tumble lower took the price below the 100 hour MA (blue line at 1.2774), the 38.2% at 1.27709 and briefly below the 50% retracement of the move up from the November 10th low at 1.27507. The low reached 1.2748. BTW the 200 hour MA is not far away at 1.27419 and moving higher.
The fall was significant. It took 7+days to move up from the Nov 10th low, and only 7 hours to retrace half the move. So slowing at the 50% makes sense (went too far, too fast).
The question now is "Does the correction higher stall ahead of the 100 hour MA (blue line at 1.27745 currently)"?
Stay below that MA and the sellers are more encouraged and in control. There could be another run at the lower support targets.
Move above the 100 hour MA, and the fall may have been too fast.
So key test at the 100 hour MA....

