
Ceiling defined by the 100 hour MA
The USDCAD tried to move higher earlier in the day.
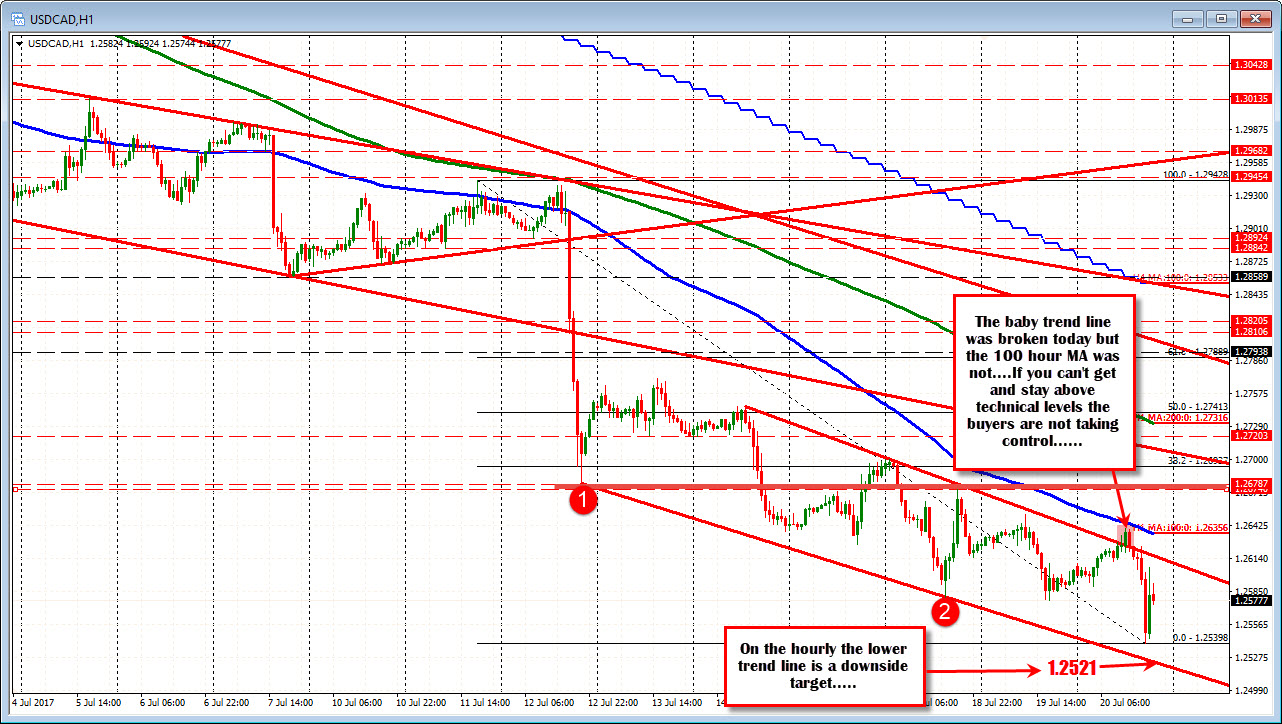
The price moved above a baby trend line on the hourly Yesterday (and on Tuesday afternoon), the line was approached but not really reached. Today that line was broken, but the 100 hour MA got in the way (the ceiling), and the marker price rotated back to the downside.
A new low was made (lowest low since May 2016) and the price is getting closer and closer to the May 3rd low of 1.2460 (see daily chart below). Note also that the last two trading days has been able to stay below the 1.2654 level (yesterday's high was 1.2652 and today's high stalled at 1.2640). That is more bearish.
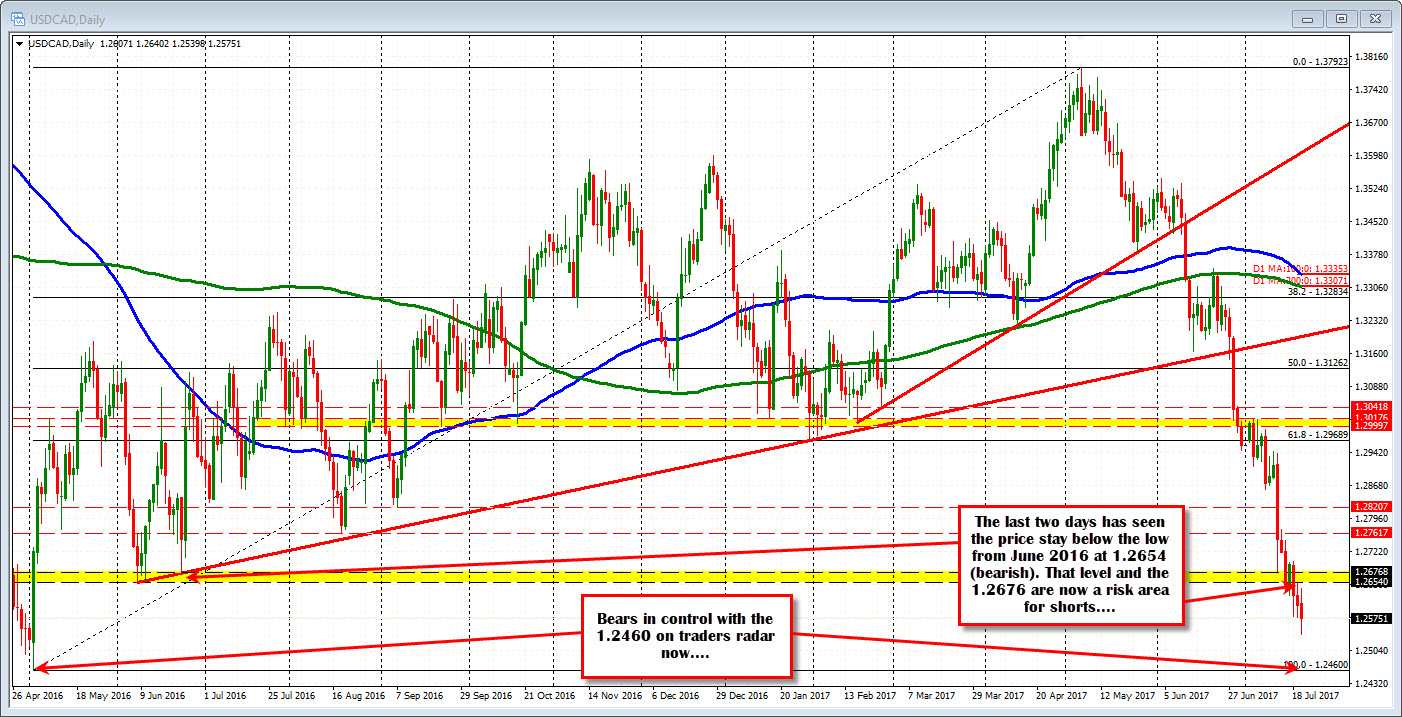
The sellers remain in control with the 1.2521 trend line on the hourly chart and the 2015 low at 1.2460 the next downside targets.
On the topside, 100 hour MA is the closest hurdle to get above at 1.26357 (MA is moving lower). Note, however, that even if broken, the levels above it (like 1.2654 and 1.2676) will create other challenges for buyers. So be aware of the tough sledding on a rebound. There are a lot of minefields above.

