Works its way to toward 200 day MA and 38.2% retracement
The USDJPY did not really stall that much at the 200 and 100 day MA at 111.68-72. We currently trade at the 111.64 level.
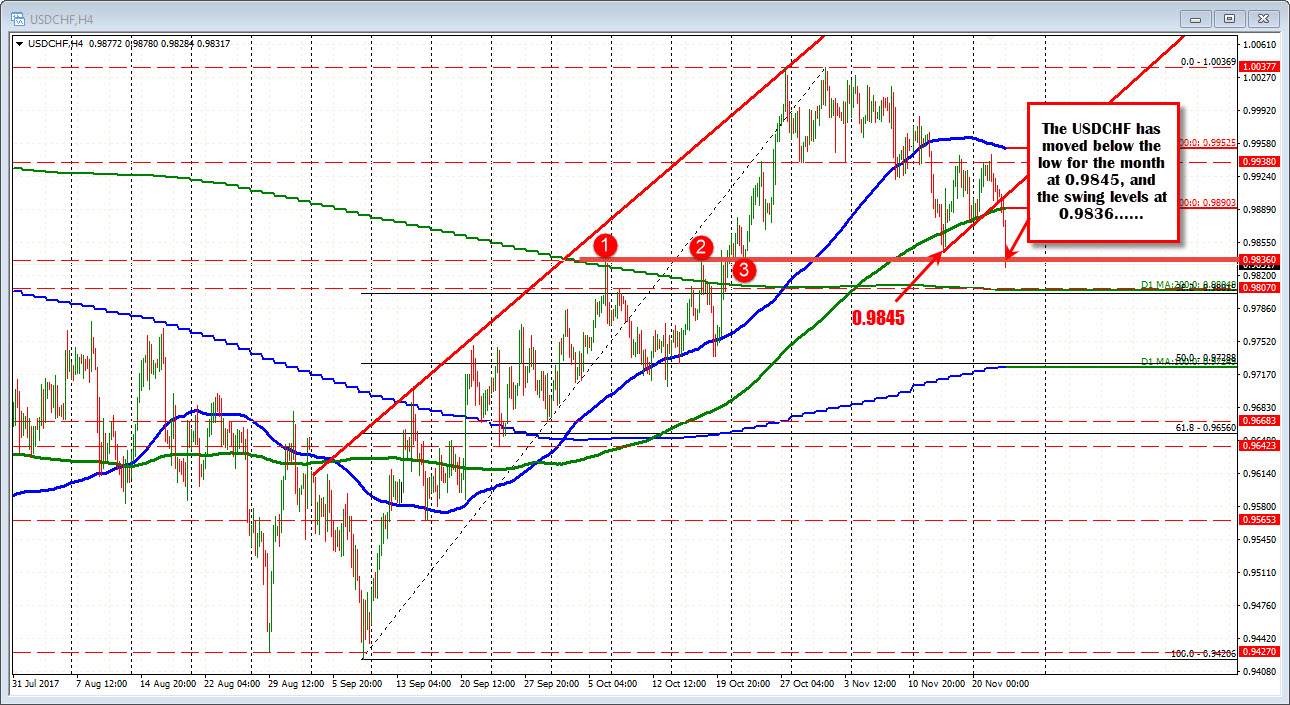
Over in the USDCHF (see chart above), that pair is also moving lower as the USD continues to be hit.
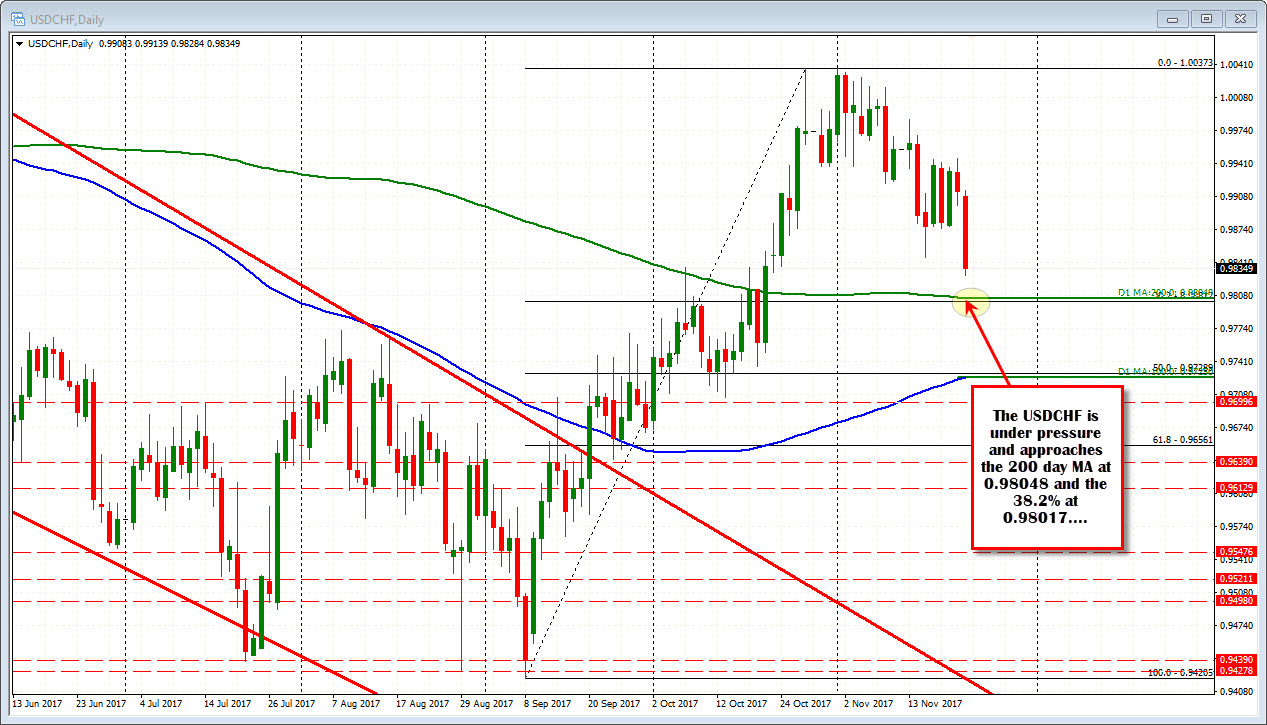
Looking at the daily chart above, the price is trading at the lowest level for the month and at the lowest level since October 23rd. Ahead, sits its 200 day MA at 0.98048. The 38.2% of the move up from the September low comes in just below that level at 0.98017. That area becomes the next key target on continued weakness.
Drilling to the 4-hour chart, the pair had swing highs/low at 0.9836 area. It was a high on October 6th and October 18 and a low on October 24. We are trading below that level now.