
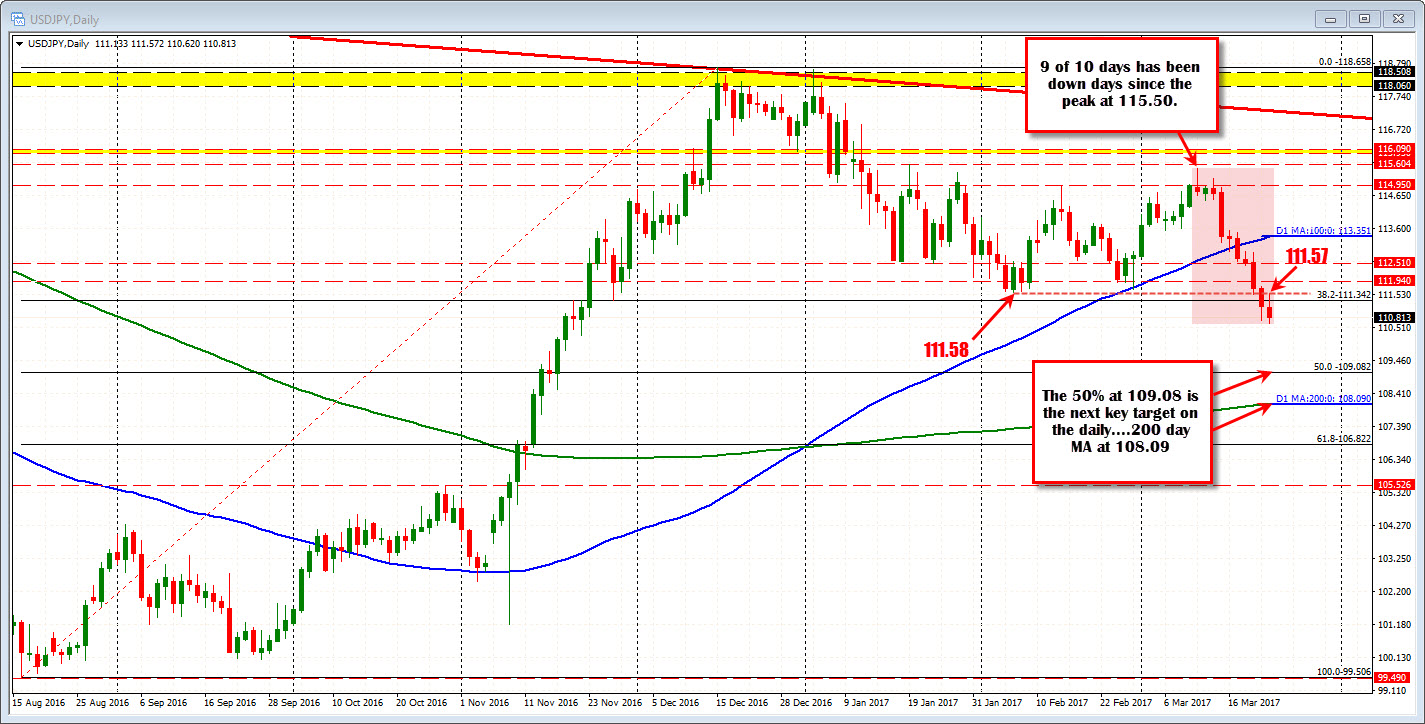
If closes lower, it would be 8 straight days...
The USDJPY peaked on March 10 at 115.50. Since then the price has been down 9 out of 10 days (if close lower today) and 8 straight (if closes down). The low just reached 110.62. ON the way down, the 100 day MA was broken at 113.06 and the price has ratcheted down since that break. The 50% of the move up from the August 2016 low comes in at 109.08. The 200 day MA comes in at 108.09. Of note today, is the high at 111.57 stalled just ahead of the swing lows from February at 111.58. That may have gave the sellers the reason to sell. It is now a close risk level for sellers. Get above that line and sellers lose a battle to the dip buyers. We could/should see the buyers come back in.
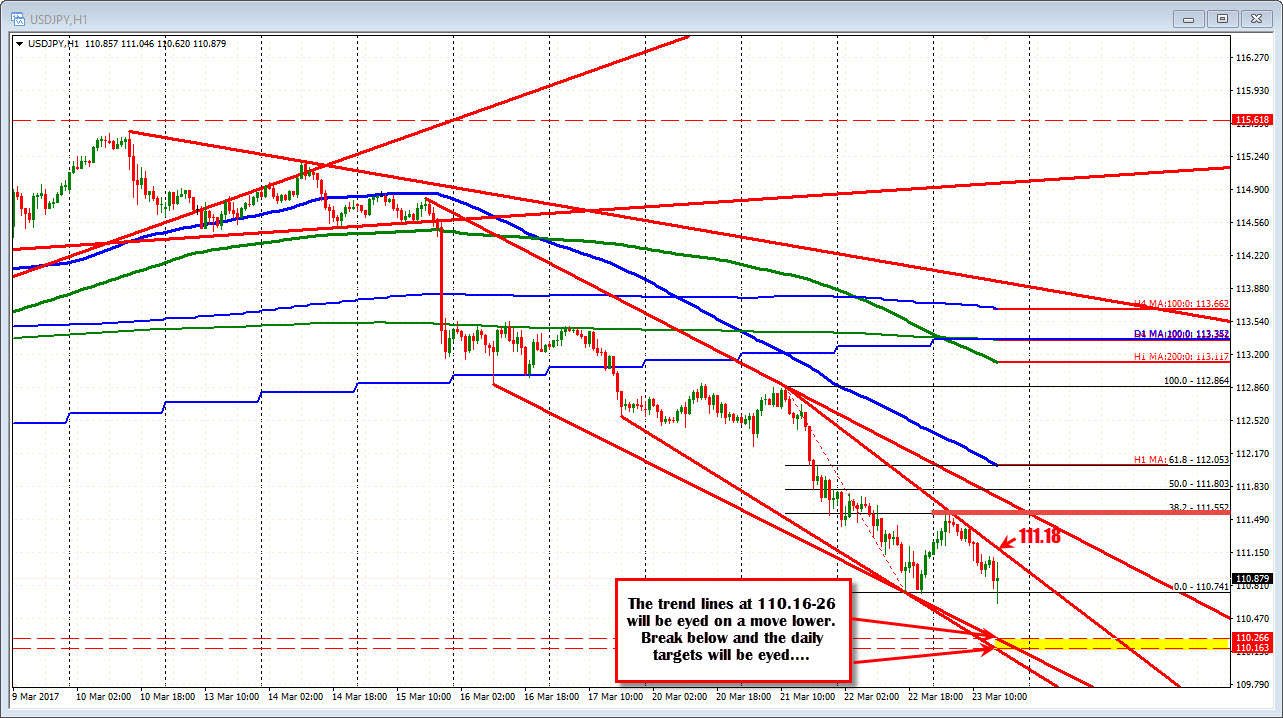
What is the hourly chart saying?
The correction off the double bottom yesterday moved up to the 38.2% retracement level at 111.55. A trend line connecting resent lows comes in at 111.18 now. The close yesterday was at 111.15. The market traders might look to defend the 8 day losing streak and the trend line on a corrective move higher. A move above would be a tilt to the upside - technically at least - with the more important 111.58 area as work in progress for the buyers/bulls. That level is more important.
On the downside, the lower trend lines cut across at 110.266 and 110.16. That is the next target I see now for the pair.
The House vote later today will push the market. Stocks are down a little in early trading. The US yields are steady near unchanged levels. The market may be treading water for the time being but the technical levels are in place for the news and the reaction.

