
US stocks open higher. Yields are little changed
The USDJPY is higher, but there is a lot of chop in the price action.
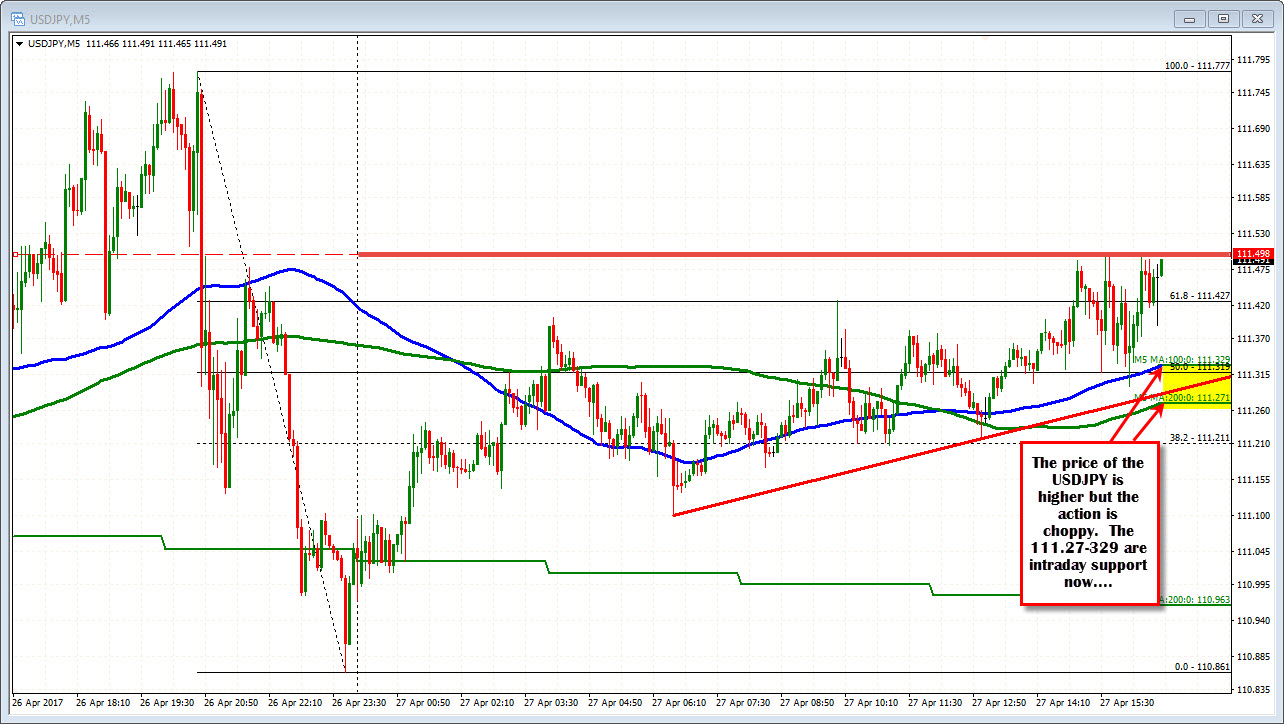
Looking at the 5-minute chart, the pair is trading near the day highs. In the NY session, the price has for the most part, held the 50% of the move down from the high yesterday at 111.319. The 100 bar MA on the 5-minute chart is near that area too. Below that is an intraday trend line and 200 bar MA.
Are these all solid levels? No.
As you can see, the price has traded both above and below the MAs and 50% retracement. However, the market is moving higher. The price is above the trend line and MAs. They are in a row at 111.269 to 111.32. If they hold, then technically, the picture is more positive. They define risk for longs. If they are broken, the picture is not bullish.
On the topside, the 111.50 level has a been a ceiling. A move above is another step in the upside direction.
For patient buyers wait for something nearer the intraday support.
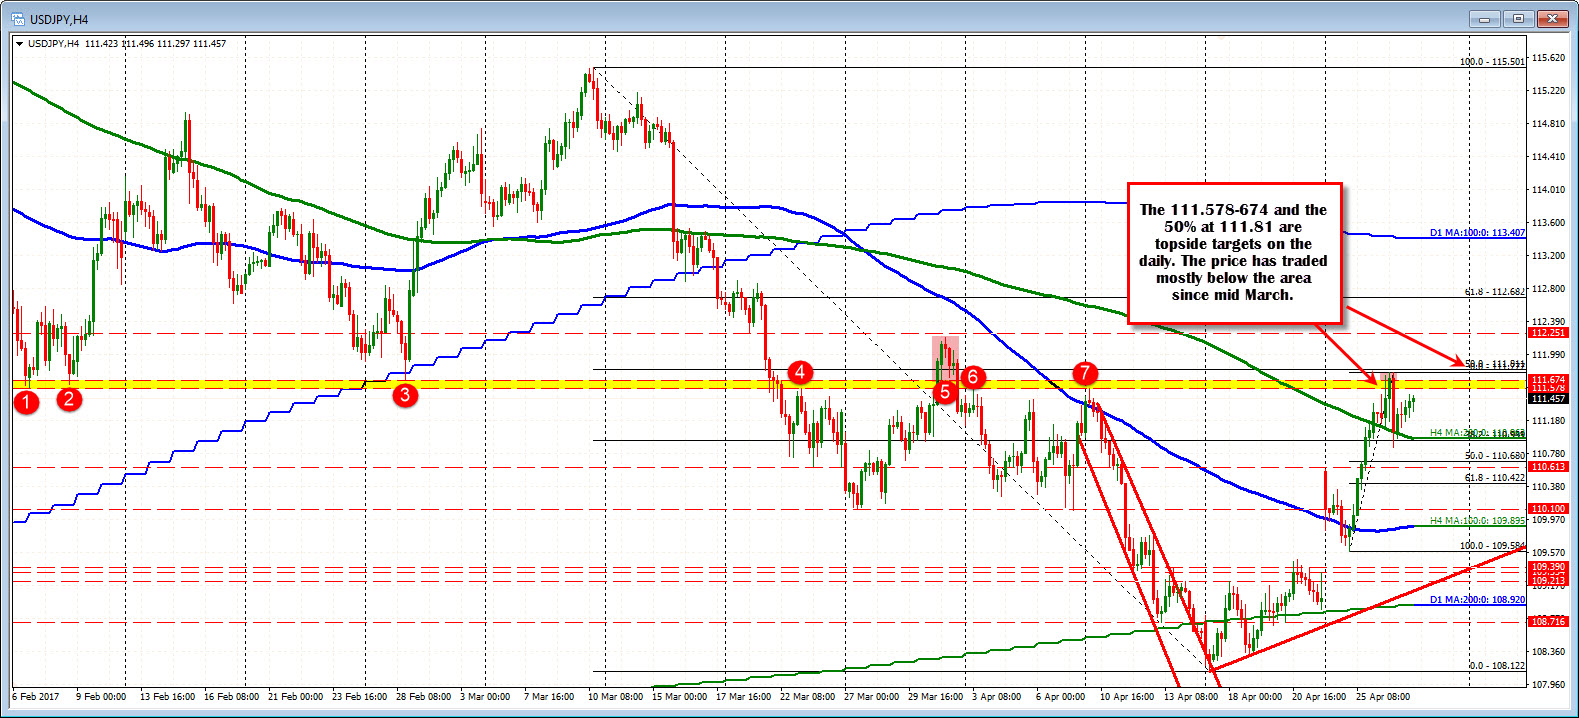
If you don't like the dollar, the 111.578-67 and then 111.81 are topside resistance levels to lean against. They represent a number of swing levels on the 4-hour chart (yellow area in the chart below), AND the 50% of the move down from the March 2017 high at 111.81. Since Mid March the price of the USDJPY has traded mostly below the yellow area. The high from earlier this week, found early sellers against the 50% (the high reached 111.77).
US stocks are trading higher in early trading. The bond yiels are up 1 to 2 BP now.

