
Down and back up
The EURUSD raced lower on the collapse of the German coalition. That tumble in the early minutes of the Asian session, sent the pair to a ow of 1.1721. Since then the pair has rebounded back higher and even took out the Asian high (high reached 1.18079). We are back at 1.1775. The close on Friday was around 1.1787. Downs and back ups.
So what has the price action left in it's wake and how can that help us going forward?
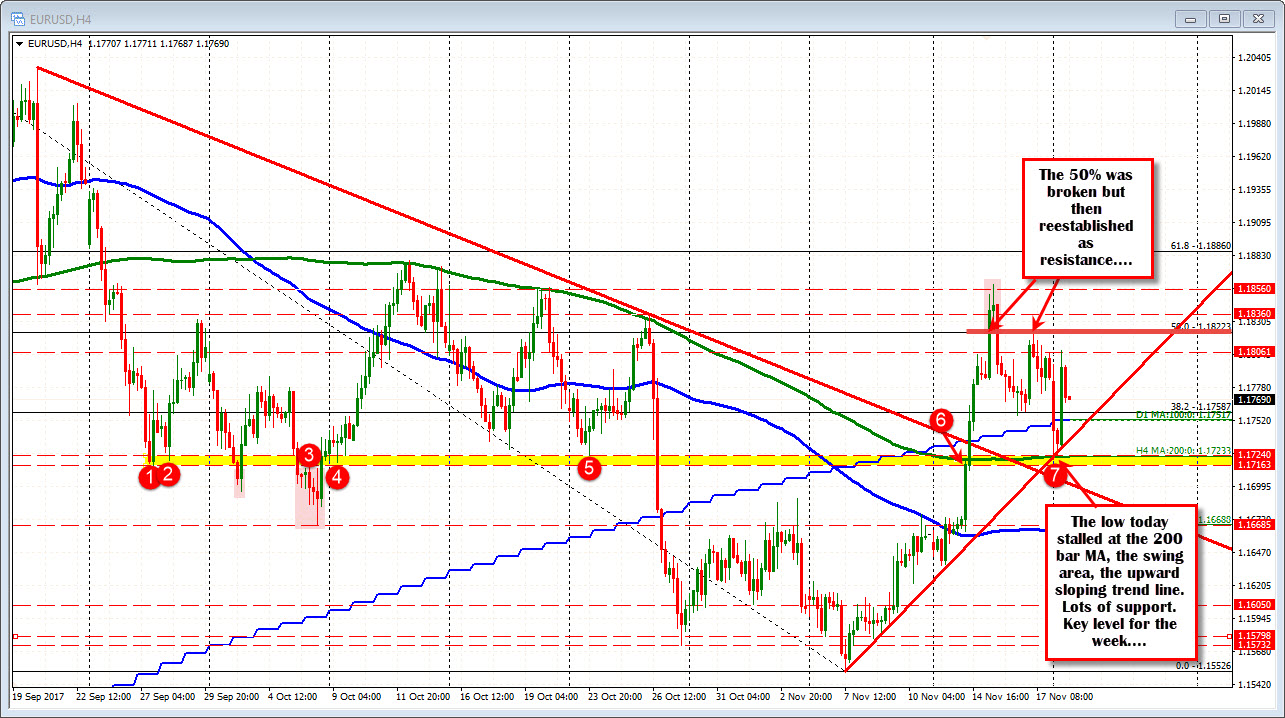
Looking at the 4-hour chart, the fall lower fell sharply in the Asian session. Sellers were overwhelming buyers. However, that fall reached a limit. The 200 bar MA on the 4-hour chart came in at 1.17233, and a swing area where there have been a number of bounces or sharp breaks, came in at 1.1716-24 (see red circles). As outlined the low stalled at 1.1721 - in the middle of that swing area and right around the 200 bar MA as well. You might as well add the upward trend line.
Buyers entered against supprt. The price pushed back higher.
So going forward, earmark the 1.1716-24 as a key level this week. If approached it could stall the fall once again. If broken, look for a momentum run lower. That is important to know.
On the topside, I have to go to Friday's trade first.
On Friday of last week, the price peaked right before the 50% of the move down from the September 8th high (not shown but that was a key swing high). That level came in at 1.18223, and the high on Friday stalled at 1.18214 - just ahead of the level. Key level.
Yes, last week, the price broke through that level last week, but the break failed. There was a rejection of the break higher, than an acceptance of the level, as a key ceiling on Friday.
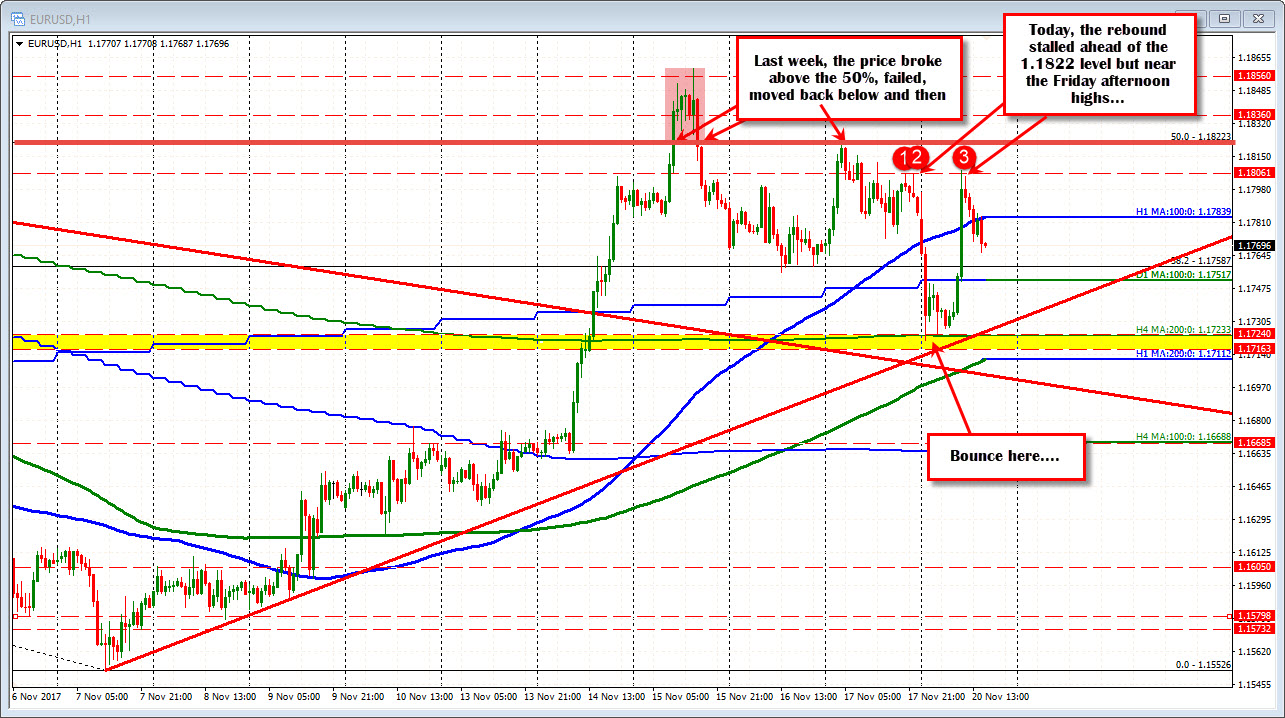
You can see that more clearly on the hourly chart below. The break failed above the 50% (red shaded area). The fall back below the level reestablished the level as resistance. That tells me, the market became more wary of life above the 50% retracement level.
What happened today? The high extended to 1.1808 on the run higher. That was near late Friday highs but below that key 50% level at 1.1822. The sellers are leaning against that 50% level. In fact, they came in ahead of it. More selling? I think so. The price is back lower.
The current price is below the 100 hour MA at 1.1783 now (blue line in chart below). That is now intraday risk. The 100 day MA is at 1.17517. That will be a target to get to and through on further weakness. Then the 1.1716-22 becomes the focus once again
The market is up and down today, but in doing so, it defined the ranges for the week going forward. The 1.1822 area is key resistance above. The 1.1716-22 is key support below. I would expect a break of either extreme to define the bias more.
But....
Right now the ceiling seems to be putting a lid on it and the more dominant idea (at least for now). Stay below 100 hour MA is more bearish. Stay below the 50%, bears still in charge. However, on a retest of the key area below, will need to see a break and run to give sellers more comfort.

