Back below $1300
The price of gold has continued its move lower. The US dollar is higher today vs the AUD, NZD, CAD, CHF and JPY. It is lower vs. the EUR and GBP. A higher dollar tends to cheapen the precious metal.
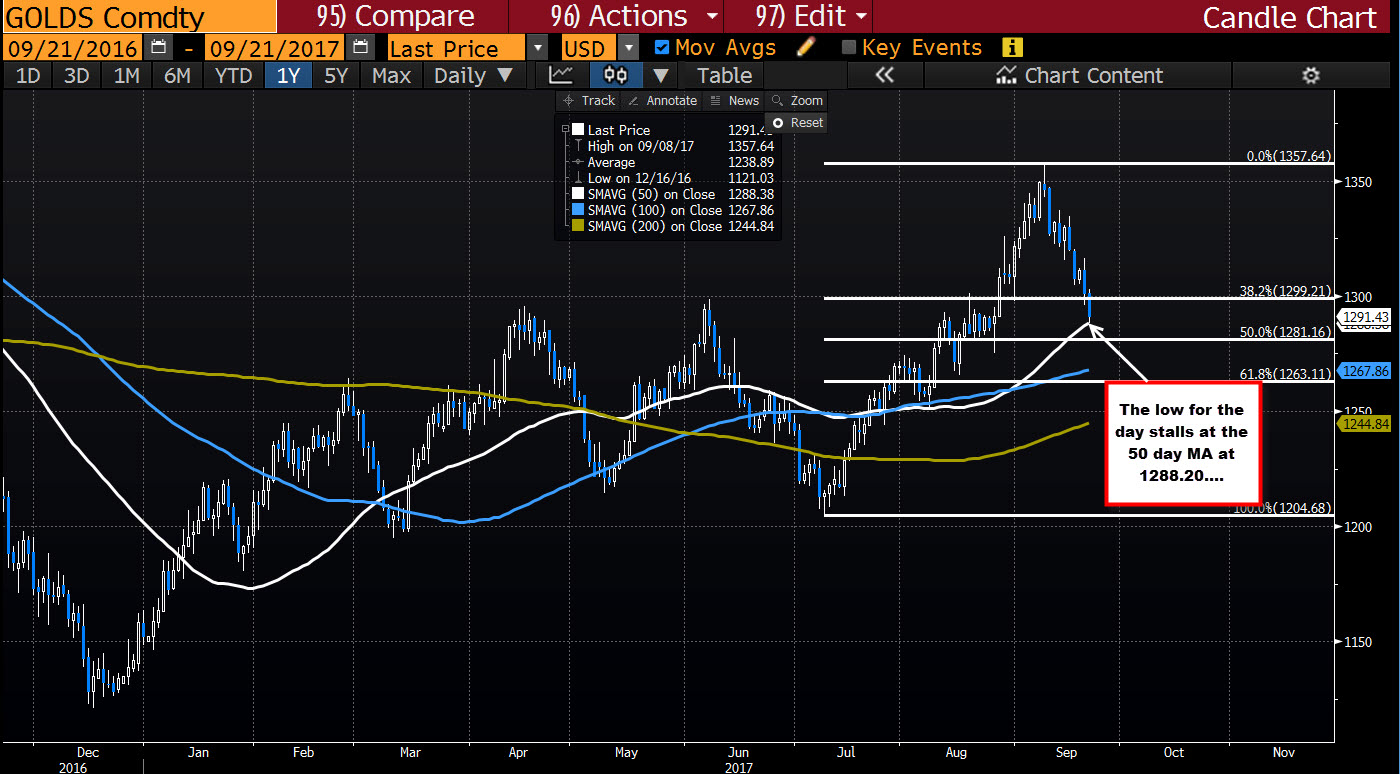
Technically, the price of gold has traded mostly below the $1300. The high did reach $1302.82 but most of the day trading today was below the natural technical level.
The low today moved to $1288.20. That was just below the 50 day MA at $1288.38 (see white MA line on the daily chart above). The current price is trading at $1291.28.
Going forward, a move below that MA line will look toward the 50% of the move up from the July low at $1281.16. The 100 day MA is down at $1267.86.
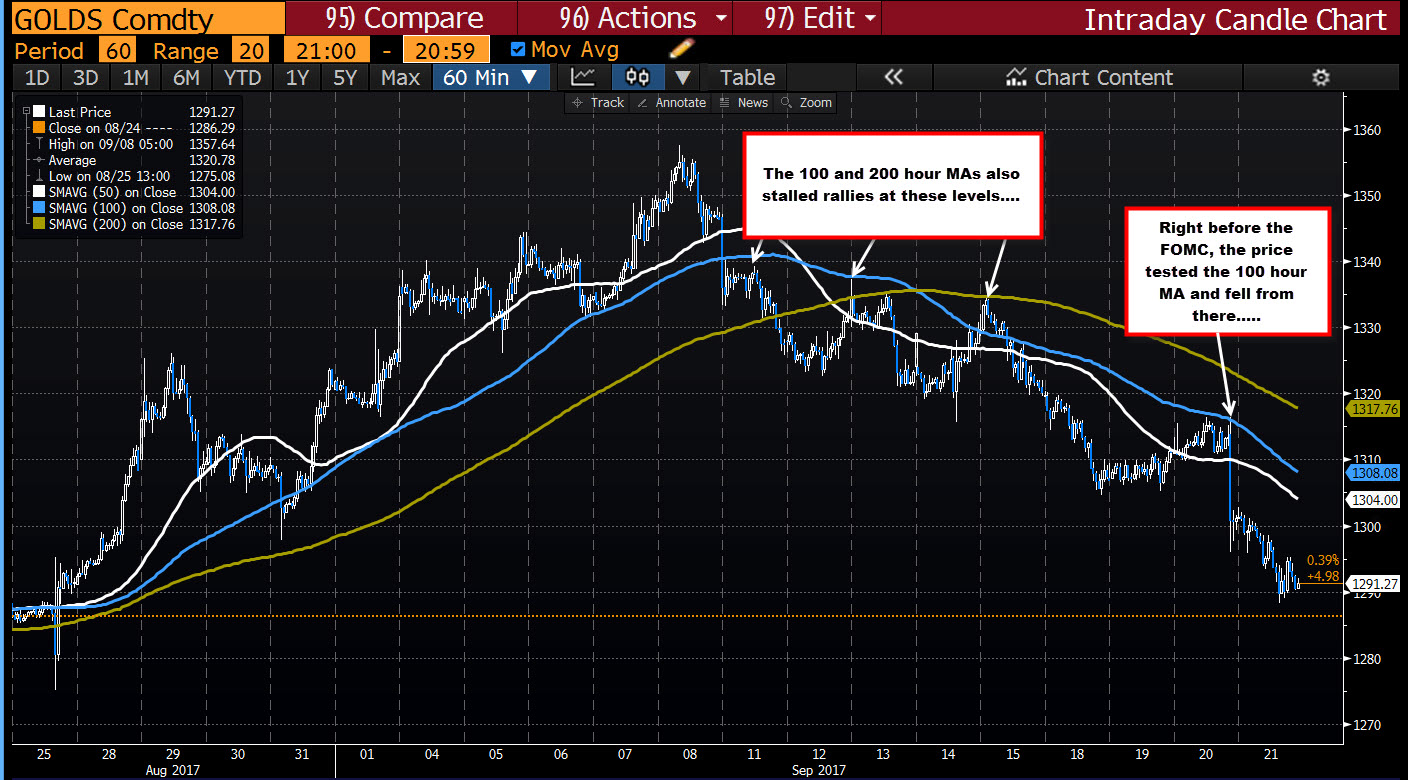
Drilling to hourly chart below, the pair has been using either the 100 or 200 hour MA as a topside ceiling to lean against on the move down from the high. The price fell below the 100 bar MA on September 11, retested that MA on September 13 and found sellers against the 200 hour MA on September 15. Yesterday the pair tested the 100 hour MA in the trading before the FOMC meeting before tumbling lower (see chart below) The 100 hour MA is up at $1308.08 (and moving lower). That MA is a risk level for shorts now.
The bias is bearish but support at the 50 day MA is a level to get below. Risk can be eyed against the 100 hour MA.