
Tests 38.2% of the move down from September high
The price of gold has been waffling higher and lower since mid October. The low reached $1263.35 on October 27. That low was higher than the low from October 6th and subsequent lows since then have also been higher. The price since October 23rd has moved above and below the 100 day MA. There have only been two trading days since that time when the price did not trade the 100 day MA. That says to me that the market does not know what to do. So it happily hangs around the 100 day MA
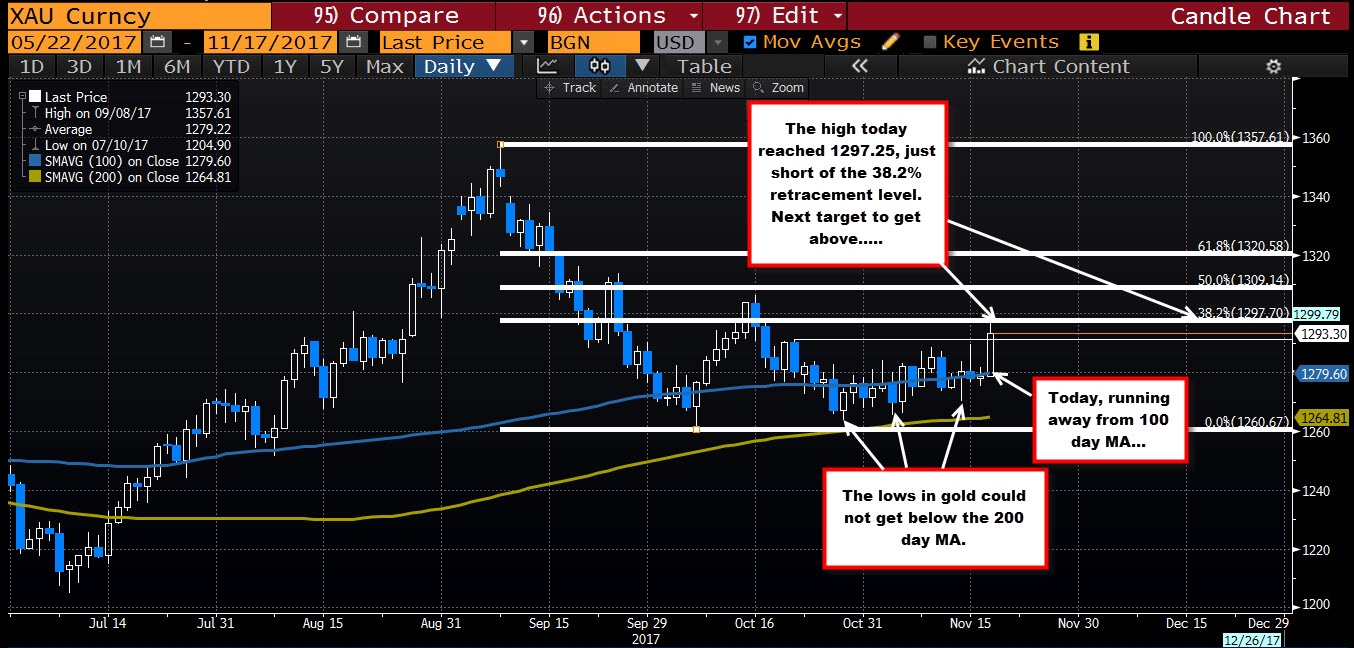
By the way, the price has not been able to trade below (or even to), the 200 day MA (green line at 1264.81 currently). The last time the price traded below that MA was back on July 17th.
Today, we have seen the precious metal trend higher. The price is up over $15 now and trades at $1294. That move has taken the price away from the 100 day MA and to the highest level since October 17th. The market is making a play to the upside.
What next?
Although sharply higher today, we did stall against the 38.2% retracement of the move down from the September high at $1297.70. The high today reached $1297.25. If we are to really get the bullish ball rolling from here, a move above that 38.2% retracement level will be eyed as the next key target to get to and through. If it can, the natural $1300 level and then the 50% midpoint, will be the next targets (at $1309.14).
A good 1.20% rise today in gold, and a break away from the 100 day MA. It is now up to those buyers to keep the momentum going through the 38.2% retracement level.

