
Trading is getting more contained too....
Some of you remember the "I spy with my little eyes" children's book/game? Right?
I spy a lot of things in the GBPUSD chart.
I spy (i.e. see) a number of fake/failed breaks (see fake break video by clicking here). Those fake breaks come near the 200 bar MA on the 4-hour chart (green step line in the hourly chart below at 1.24124 currently).
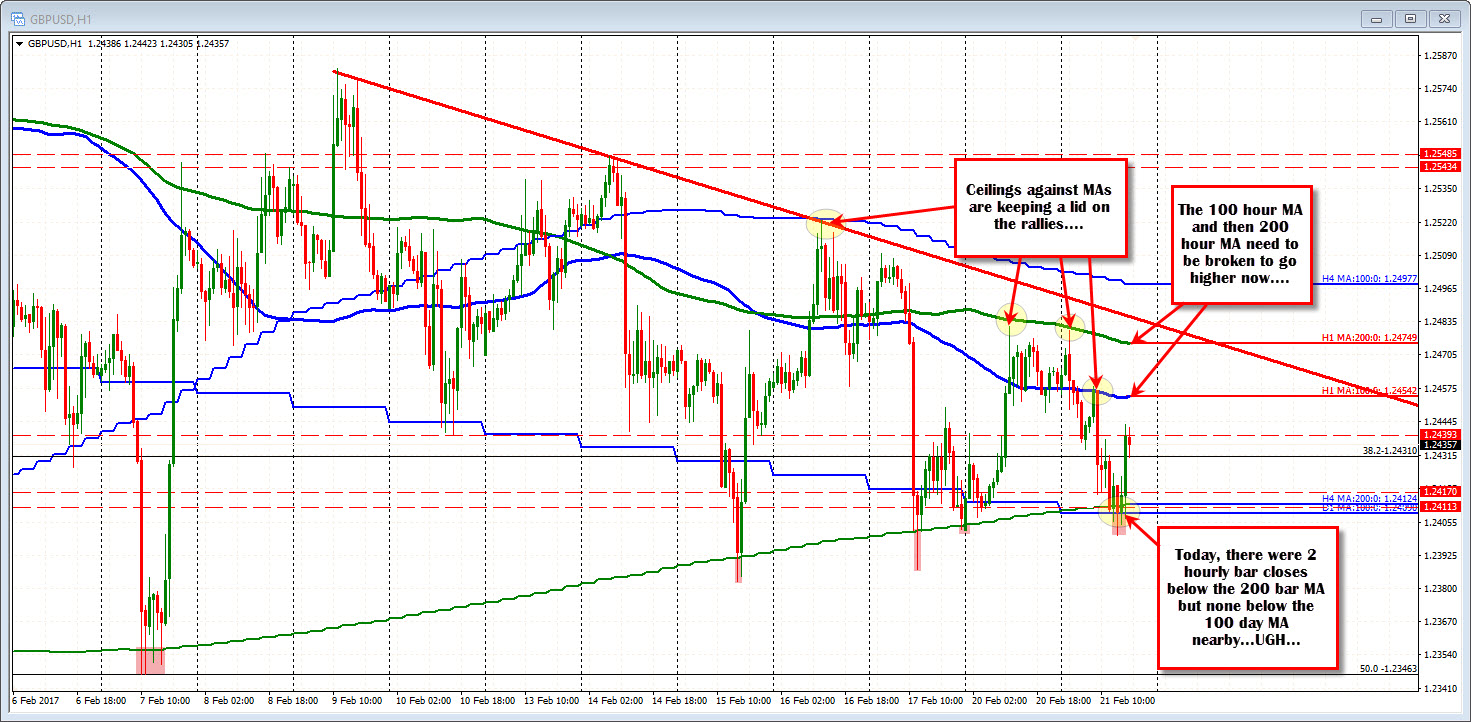
Today that "fake break" also took out the 100 day MA (blue step line in the chart above). In today's trading, there were 2 hourly bars that closed below the 200 bar MA, but zero closes below my 100 day MA (see close up below). I spy those facts from the chart below.
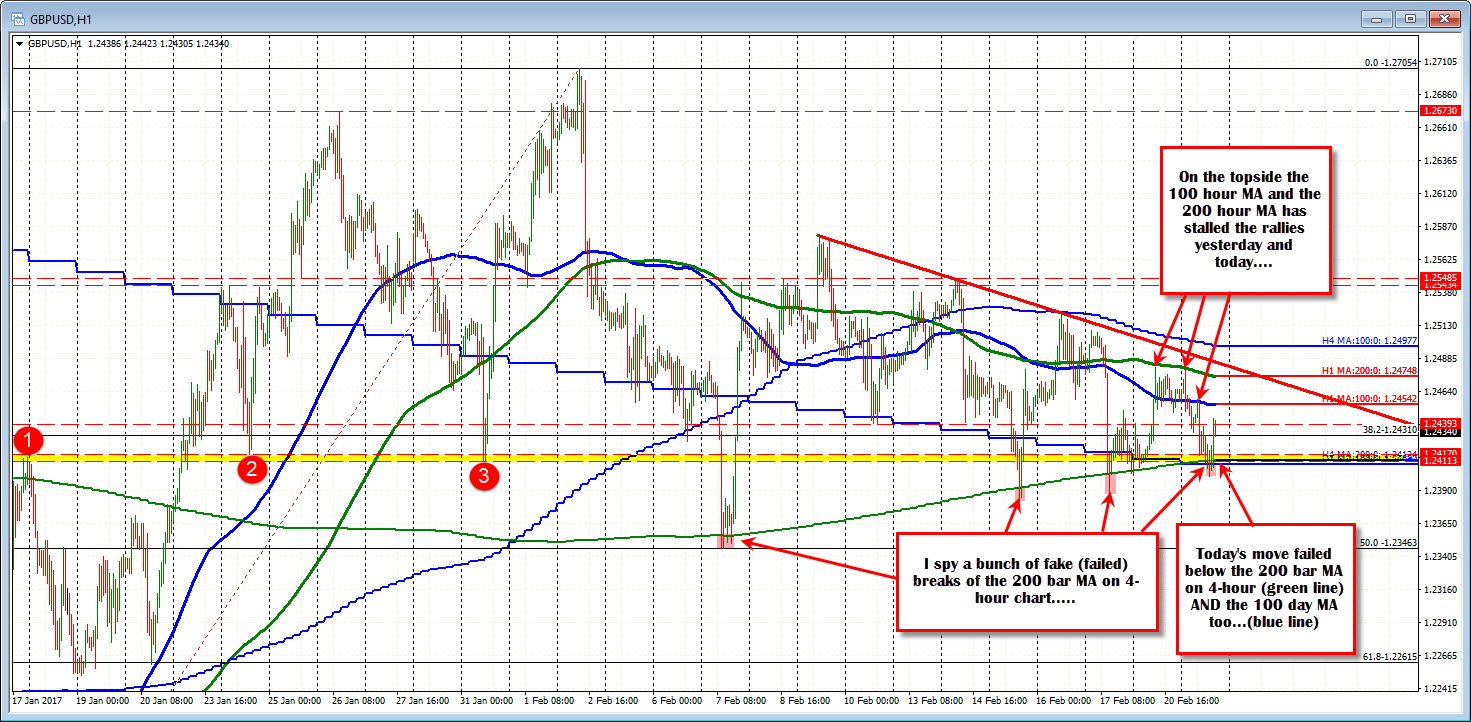
I also spy an up and down market that has been using some technical levels on the topside to stall the rallies (see my video on trading up and down markets by clicking here).
Last week, the 100 bar MA on the 4-hour chart (blue step line) AND trend line resistance stalled the rally near 1.2523. Yesterday and earlier today, the 200 hour MA (green smooth line at 1.24749 currently) stalled the rally. And later in the day today, the 100 hour MA (blue smooth line) stalled the rally (currently at 1.2454).
So with lots of failures below the 200 bar MA on the 4-hour chart (and the 100 day MA at the area too) at the 1.2409-12 area, that is the key level to now get below (and stay below) if this pair is going lower.
On the topside, the 100 and 200 hour MA above at 1.2454 and 1.2478 respectively,will be the technical levels to get and stay above.
That is what I spy at least. Do you spy the same thing? At some point the market will decide which way it wants to go. In the meantime, use the levels you spy, as levels to define and limit your risk (and lean against).

