
But bouncing.....
Bitcoin surged higher in trading today and reached a high of $2798.97. Two days ago it was at $1983.44. From that low to the high, that represents a 41% increase.
If you were to go back to the end of March low at $961.59, the gain has been nearly 200%. Wow! That is a lot of dough for the longs.
The bad news is the price is down from that near $2800 high today to around $2450. That is not so great if you were a buyer near the highs.
Can technicals be used to trade this crypto-currency?
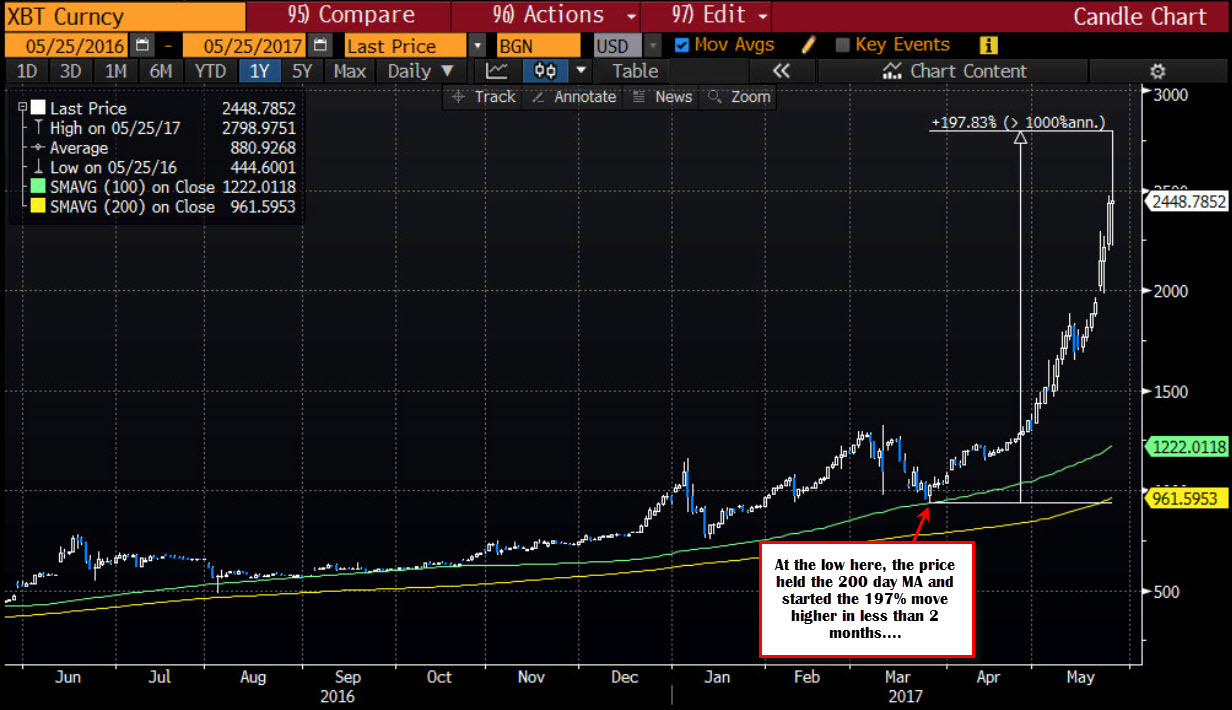
Looking at the daily chart below, the low at the end of March stalled right at the 200 day MA. Traders leaned and the price surged nearly 200% in over the next two months. Risk was defined and limited.
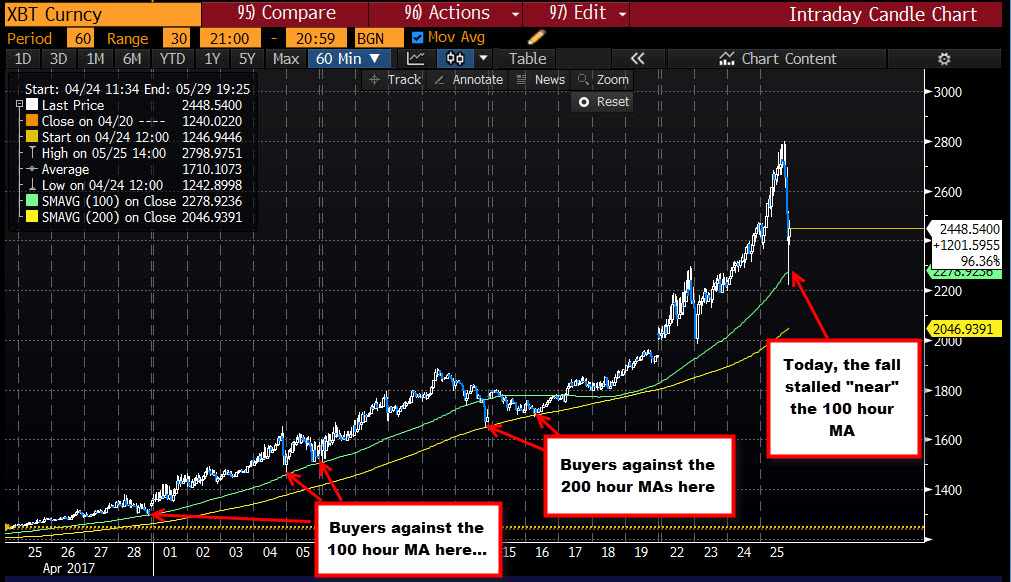
Drilling to the hourly chart below, as the price was pushing higher in this month, the currency stalled corrections at the 100 hour MA on 3 separate occasions. On May 12th, that 100 hour MA was broken, but the price stalled at the 200 hour MA. On May 16th, the price did dip below the 200 hour MA by about $7 (1698 vs 1691 low), but quickly rebounded. That failed break, started the push back to the upside. Technical MA tools (100 and 200 hour MA) did the job.
What now?
Zooming into the hourly chart, the price move up from Tuesday followed a trend line higher (see red circles). That trend line was broken at the $2480 area today after the failure to get above the natural $2800 resistance level (there is not much in technicals at the high admittedly).
Note on the decline, that the 50% of the move up from Tuesday's low was tested at 2391.20, then fell below that level and tumbled below the 100 hour MA. However, buyers came back in and have taken the price back above the 50%. The current bar stalled the low near the 50% level at 2391.20 level. So the 3 hourly bars, has found buyers at the lows near the 50% retracement level. Risk is defined and limited against the level now.
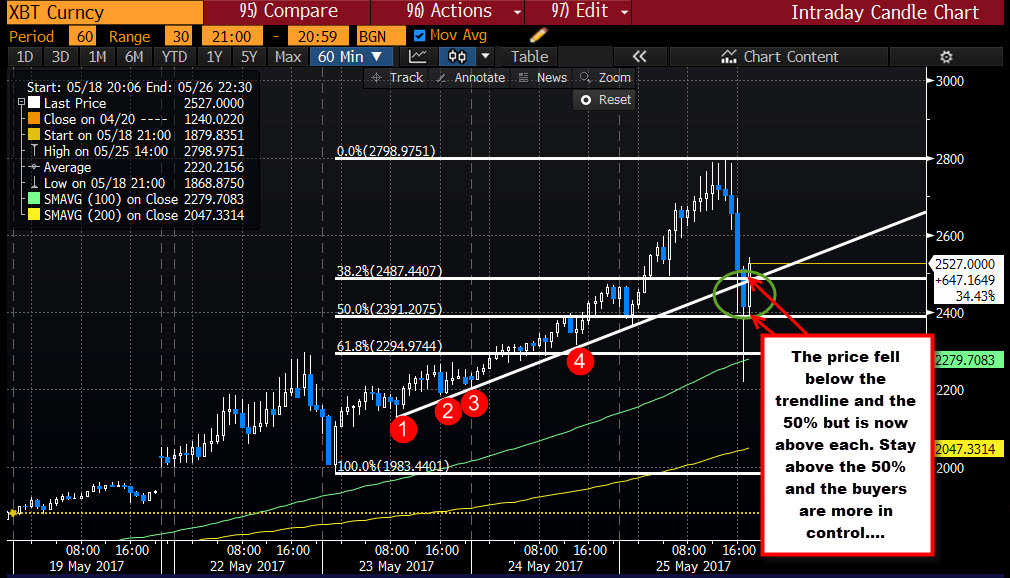
Going forward, technically if the price can stay above that 50% levell 2391.20 level, the buyers are more in control technically. A move below and the bias could turn the tide around to more selling (like we saw today but failed). The 100 hour MA at 2279 currently (and moving higher) will be another key level to stay above if the bulls are to remain in full control.
On the topside, let it run. However, with the high just below $2800, I would expect sellers to lean against the level with stops above.
PS risk in this "currency" is HIGH. If you don't have a stop, you are playing with fire.
SUMMARY: Like many traded instruments, traders will lean against risk defining levels. The daily chart bottomed at the 200 day before surging higher.
ON the hourly chart, the 100 and 200 hour MAs were levels that traders leaned as well. Also a trend line stalled declines on the way higher over the last few days. The 50% of the trend leg higher was broken but support reestablished against the level.
It looks to me that those trading the currency, are still minding the technicals. The price action is very volatile but trader reacted.

