
So what should you look for in next weeks trading for the pair.
The EURUSD traded in a relatively narrow trading range this week of 130 pips. The high reached 1.1859. The low came in at 1.1729. The high range this year has been about 290 pips. The low range is about 90 pips. The midpoint of the ranges comes in about 190 pips.
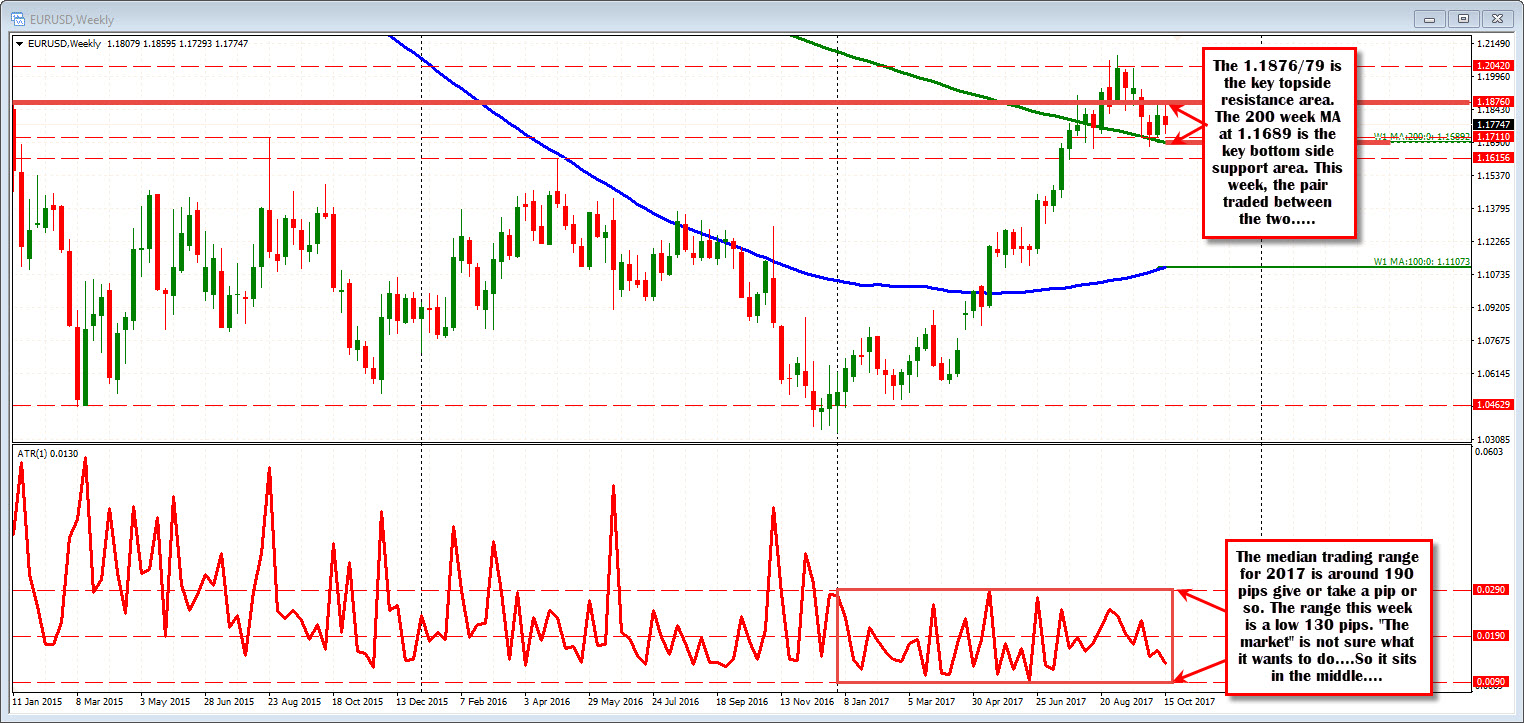
Looking at the weekly chart, the high for the week came in below the 1.1876-79 level. The 1.1876 level is the June 2010 low. I stilll consider it a key "remembered" level.
The 1.1879 level was the high from last week.
That area represents a key barometer for bullish and bearish on the topside. Get above and it is more bullish. Stay below and it may not be fully bearish, but it is less bullish (which could lead to more bearish). The 1.1859 high this week stalled 20 pips short of that resistance area.
On the downside this week, the low at 1.1729 came up short of the 200 week MA at 1.17893 (by about 40 pips). The 200 week MA is another key barometer for bullish and bearish and helps to keep the bias a little more bullish overall. Until the price moves back below the 200 week MA, you can argue buyers are more in control.
So the high low range this week stayed below a key bullish/bearish line above at 1.1876-79, and above a key bullish bearish line below at 1.1689. That range between levels is 190 pips. Ironically, that is the median range for the year. This weeks 130 pips range ended in between. It was a non-trending week.
Non-trending to me, says "the market" is unsure of what it wants to do. That is ok. At some point, it (i.e. , "the market") will decide go higher or lower. The ECB meets next week. Be on the lookout for a break and run. I will be using those levels on the wide, to help define the break for hopefully the next big move.
Drilling down into the 4-hour chart below, interim key levels can be carved out as the "market" decides more bullish or more bearish.
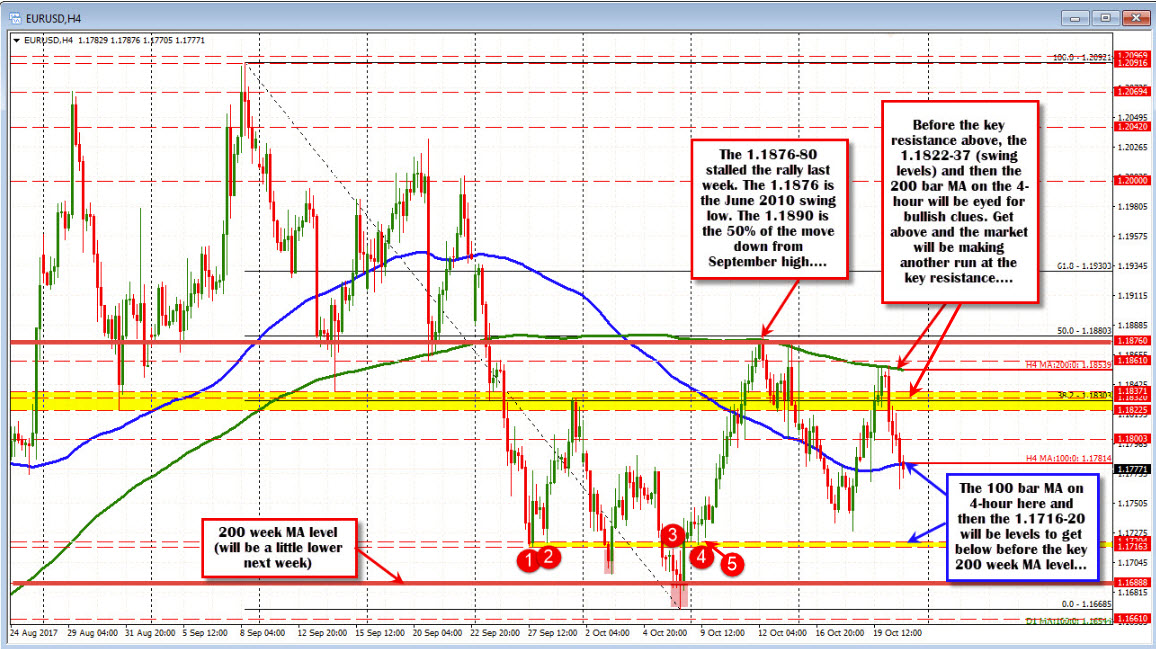
For example, the pair is currently trading at 1.1772. That is near the 100 bar MA on the 4-hour chart at 1.17814 (blue line in the chart above).
Next week, that MA line will help to define the bias for the shorter term. Stay below and then get below the 1.1716-20 area, which is home to some swing levels from a few weeks ago, and the test of the 200 week MA can be expected. Those are the bearish steps for traders next week.
If the price moves back above the 100 bar MA at 1.17814, look for a more upside potential in the pair.
Targets above would be:
- The 1.1822-37. That area is home to swing level going back in time.
- Above that is the 200 bar MA on the 4-hour chart at 1.1854 (green line) will be eyed. The last 5 tests of that MA line has found sellers. KEY, KEY LEVEL.
Get above that 200 bar MA line and the next stop is to break the 1.1876-80 area. Then it is off to the races.
Those are the bullish steps.
SUMMARY:
The 130 pip range this week says, little volatility and "the market" does not know what it wants to do (go higher or lower).
As a result, we as traders need to map out the plan higher and lower. The 4-hour chart has defined some key level above and below which help define steps on the way lower and steps on the way to the upside.
Follow those steps on breaks. Look for momentum to start to develop at some point (remember the market is really unsure)
Just listen to the market, by following the technical clues. It will tell you whether the buyers or the sellers are taking more control and if non-trending turns to trending, you stand the chance of booking some good pips.

