
| XAU/USDChart Levels: Support 1320.0…1280.0… 1250.0. Resistance 1360.0…1370.00…1400.00 |
| Strategy | Entry | Stop | T1 | T2 |
| Weekly: Long | 1280.0 | 1220.0 | 1360.0 | 1388.00 |
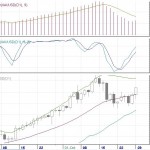
This week the gold market will trade within Bollinger bands 1280.00 – 1380.00 dollars per troy ounce. Since curves of moving averages mA (100) and mA (200) create a bullish combination, market participants are waiting for movement up rather than down. Previous bullish target T1 = 1350 was filled, so we are waiting for downward correction to re-enter Long. Now the market is testing resistance at 1359.50 level. If this level is not broken, wait for market consolidation within the Bollinger bands.

