
There’s a great deal of convergence on the USD/CAD daily chart.
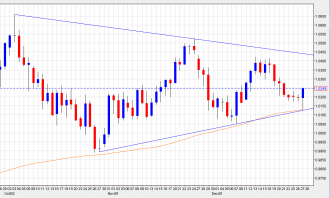
- The 100-day moving average held as support for the third time in the two months. The two prior tests resulted in 300-pip rallies over the subsequent week. The 100dma was also a particularly good indicator during the 2010-11 downtrend.
- Buyers came in at the uptrend from the previous lows.
- The daily candlestick is showing a significant reversal with a close above 1.0233 as confirmation (spot at 1.0241)
- The pair is forming a wedge that I expect will resolve to the upside in mid-Jan

