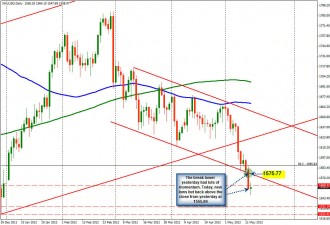
Gold has made new year lows today (lowest since December 30 2011). The fall yesterday extended below trend line support on the daily chart above (at the 1578 area) and extended that move today. However, the price is above the closing level from yesterday (at 1555.89) would be at least a somewhat positive development for at least a correction.
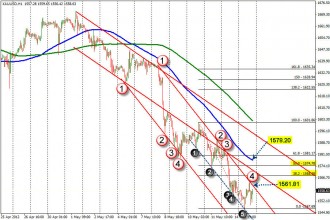
Looking at the hourly chart below, the price decline has accelerated over the last few weeks (steeper channel trend lines). The correction off the low today extended to the top side trend line but sold off. The price is now moving back toward that line at the 1561.80-90 area. A move above that level should help confirm a bottom for the time being and lead toward 1568.38, 1574.78 and the 100 hour MA at the 1577.64 (blue line in the chart below). A failure to extend above toward these levels, keeps the downseide trend in tact.
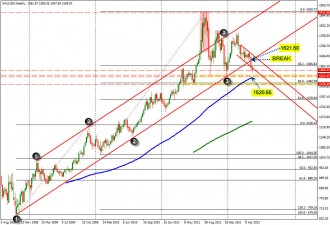
Looking at the weekly chart, the price of Gold although in a longer term uptrend, has been more consolidating since July 2011 and more bearish most recently. The price fell below longer term trendline support at the 1620 area last week and the 38.2% of the move up since the October 2008 low at 1585.83 (see chart below). The low from September 2011 is approaching at the 1532 level as is the low from Dec 2011 at 1522.55. Moves below these price levels would likely target the 100 week MA at the 1515.50 – a break of which would increase the bearish sentiment measureably. SO altough the price is in a small corrective move today, the downside may have some more run if the correction fails to gather any momentum higher.