
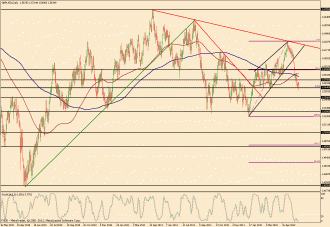
5/29/2012 – Price action on GBP/USD (a daily chart of which is shown), as of 5/29/2012, has tentatively broken down below the 1.5640 support region, which was also around the 61.8% Fibonacci retracement of the latest uptrend run from mid-January to late-April. This breakdown has been a key event, as it furthers the bearish momentum the pair has experienced after having spent the entire month of May thus far in a virtual freefall that broke down below a large and significant wedge pattern. Currently, the next major downside target resides around the important 1.5500 support region. Upside resistance on any rebound currently resides around the 1.5750 price region.
(Chart courtesy of FXDD – Metatrader. Uptrend lines in green, downtrend lines in red, horizontal support/resistance lines in black, Fibonacci retracements in purple, 200-period simple moving average in blue, 100-period simple moving average in brown.)

