
The USDCAD broke to new 5 plus month highs (going back to Dec 24th 2011) as the end of the month draws near. The pair has trended higher this month as oil falling and global worries forced traders out of risk pair. Although the move higher is impressive, the USDCAD continues to keep it’s bullish bias.
Looking at the hourly chart, the price has taken two steps higher this week (see chart above). The first leg higher corrected in the Asian session today but found buyers against the 100 hour MA and the 50% correction of that leg (at 1.0258). This kept the bullish bias in tact and bullish traders could use the level to define risk/limit risk (and they did).
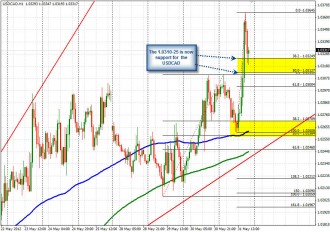
The second leg started from that level and extended to a high or 1.03645. The correction zone from that leg comes in at the 1.03127-1.03249. Stay above, and the bulls remain in control of the trend. Move below and further correction pressure can be expected.
Looking at the longer term weekly chart below, the price made a clear and strong break above the 100 week MA (the week of March 6th). Before that break a total of 14 weeks kept that MA as resistance with 6 weeks testing that line and falling back. The break three weeks ago was significant and helped propel the pair higher. On the topside, the 200 week MA and trend line comes in at the 1.0560-83 area. If the price can keep the bullish momentum, this area would be a key upside target for the pair.

