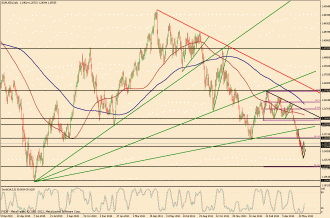
6/6/2012 – Price action on EUR/USD (a daily chart of which is shown), as of 6/6/2012, has formed a potential bearish flag pattern after having rebounded from its 23-month low of 1.2286 hit just a few days ago at the very beginning of June. This pullback that has just today hit a high of 1.2583 is thus far just considered a very minor retracement within a fast and steep bearish trend that has been in place since the beginning of May. Strong current resistance for this retracement resides around the key 1.2650 support/resistance price region. The potential bear flag that has formed is providing some indication that the strong downtrend may soon continue its bearish run. This would be evident on a breakdown below the flag’s lower border. In that significant technical event, price could begin making its way towards targeting key downside support around the 1.2150 price region, an important prior support level as well as a 261.8% Fibonacci extension (when measuring the widest span of the large triangle pattern that occurred earlier in the year).
(Chart courtesy of FXDD – Metatrader. Uptrend lines in green, downtrend lines in red, horizontal support/resistance lines in black, Fibonacci retracements in purple, 200-period simple moving average in blue, 100-period simple moving average in brown.)


