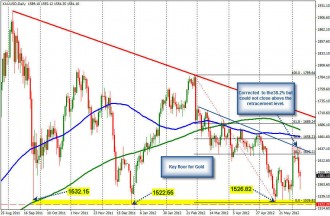
Gold corrected toward the 38.2% of the 2012 trading range on Wednesday (see daily chart) at the 1627.22 level and although the price was able to breach above the MA, the price could not close above this retracement level (bearish). The price yesterday moved sharply down and that trend was extended to new lows today.
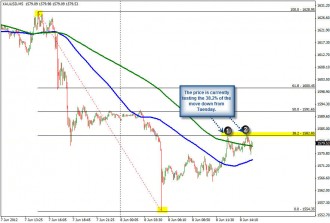
The low today found some fairly aggressive buyers and the price is currently retracing and testing resistance against the 38.2% of the move down from yesterday’s high (see 5 minute chart). That level come in at 1582.85. The high just peaked at this level. Also near the level is the 200 bar MA (green line currently at 1578.70). These levels will be eyed for intraday clues. If the price can stay below the 1582.85 level, and move below the 100 bar MA (blue line) in the same chart at the 1573.25 level, the trend down may continue. If the price moves above the 1582.85 level look for continued upside potential .
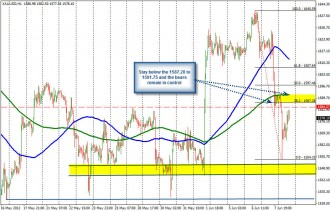
The next target on a break above the 1582.85 would come at the 1587.28 level. This is the 38.2% of the move down from the Wednesday high. Above that the 200 hour MA at the 1591.75 level (see hourly chart below) is the last line of defense for the sellers. If the price moves above this level, traders will once again be questioning the trend and a move back higher is likely to be in the cards.