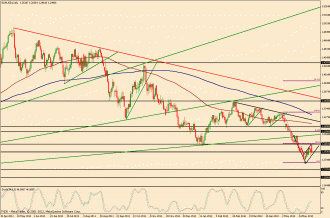
6/11/2012 – Price action on EUR/USD (a daily chart of which is shown), as of 6/11/2012, has found strong resistance to start the week off around the important 1.2650 support/resistance region, which is also around the 38.2% Fibonacci retracement of the recent steep bearish run that started in the very beginning of May and hit a low below 1.2300 in the very beginning of June. Therefore, within the strong prevailing downtrend, the current upside rebound/correction, having only retraced 38% thus far, can still be considered a rather shallow one. The correction has also formed a potential bear flag continuation pattern, which could signal further potential downside on the current bearish trend. In the event of a strong breakdown below this flag, the clear downside target resides around the trend’s low point (also the bottom point of the flag) around the 1.2285 price region. A further breakdown below that level could prompt the pair to begin targeting further downside around the key 1.2000 psychological level. Upside resistance currently continues to reside around the key 1.2650 price region.
(Chart courtesy of FXDD – Metatrader. Uptrend lines in green, downtrend lines in red, horizontal support/resistance lines in black, Fibonacci retracements in purple, 200-period simple moving average in blue, 100-period simple moving average in brown.)


