
The EURUSD corrected to the 38.2% of the move down from May 1. Perfect correction. Spain banks have been rescued and it did nothing. Why not just tell it like it is? Why not look at Greece, and Spain and Italy and come to the conclusion that the EURUSD is going to 1.1876 (low from June 2010), or 1.1200 or even parity?
The short answer is that I have seen that mistake be made time and time again. For traders it can lead to a disaster. More times than not, what is expected, never happens. Just over the weekend, the comments from traders were of a rally in the EURUSD to 1.2800, 1.300. That was expected. Now the comments are for a move to 1.1876. Go figure.
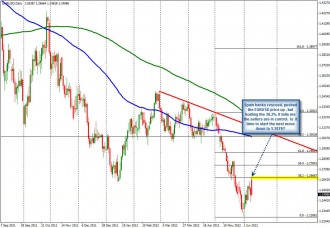
For me, if the market is declining I will still outline the support levels or targets that get in the way of a move down. At the same time I will outline the resistance level above that keeps the bias in the direction of the trend. The support targets I show allow traders to measure the directional bias and keep the trend trade on in the process. I view them as exits on the directional highway. Get passed them and you remain on that road – i.e. on that trend. Fail to reach that exit, and perhaps the route has been reversed. Move above the resistance level above and the trend bias is reversed (i.e. a move back above the 100 hour MA).
I must admit, there are many times when I, and many, have felt that that a pair should go here or there, but it never makes it. Cans are kicked down the road via temporary solutions, the disasters are avoided by something or another, focus is taken from x to Y. Also, what I/we know is markets do not normally go down in a straight line – i.e. from 1.250 to 1.1876 . However, can it happen and can it happen quickly? The answer is YES.
As proof, in December 2008, the EURUSD rallied from 1.2903 (on December 10th) to 1.4719 (on December 18th) in 7 trading days. That was 1816 pips! During that run up there was one day that had a 540 pip range. Trends are fast and directional and can go larger ranges than one thinks. So be aware and prepared. By the way, that meteoric move stopped at the 200 day MA (just FYI).
The perfect storm for the EU may be right around the corner. The bullets have been shot in Spain and yields went up, Greece election is around the corner, UGH. The sell off you talk of would be a fraction of that move.
Nevertheless, I still have to define my steps. So, if the price is to have such I move, I would expect the following steps (along with charts that support the levels):
- 1.2471 – 200 hour MA
- 1.2431 – 61.8% of the corrective move higher in June
- 1.2410 – low floor from June 5
- 1.2358 – low from May 31, base on June 1 before the price moved higher
- 1.2286 – Low from June 1
6. 1.2130 – 50% of the historical range for the EURUSD (from 2000 low). KEY
7. 1.2061 = 200 month MA
8. 1.1978 – Trend line connecting low from Nove 2005 and May 2010
9. 1.1876 – Low from June 2010 – KEY
For me, as each step is taken, it keeps the short bias/trade alive. Support becomes resistance. The trade can be managed just in case “something else happens” that was not expected.
Am I bearish? Yes. Do I think the price can go toward 1.18xx? Yes However, for me, right now I want the market price to stay below the 100 hour MA at 1.2531 today. This keeps the short alive. From there, get me below the 200 hour MA and things are on there way to step 2 above. Then follow the other steps down, and down,and down, and down…..and if it makes it to 1.1876 (or even below….GREAT.
It is all about the road traveled….

