Gold is continuing the consolidation near the highs (going back to November 11th, 2011 and February 2012). In November, the high reached $1802.63. The high in February 2012 reached $1790.48. The high today reached $1795.75 – between the two extremes. Today’s high was just above yesterday’s high at $1795.00. The failure to extend was a disappointment and the sellers took profit once again today (maybe even selling outright). The area is proving to be a touch nut to crack, but traders can easily define and limit risk against the highs (i.e., expect stops on a break higher).
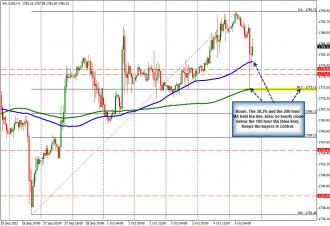
On the downside however, there is cause for pause on the selling. Looking at the hourly chart today, the price decline post the employment report, fell below the 100 hour MA (blue line in the chart below – currently at $1781.35) but stopped on the 200 hour MA (green line at the $1773.42). This also corresponded with the 38.2% of the last move higher from the September 26th low. Is this a key support level now? Yes.
With the price back above the 100 hour MA, the bulls remain in control. There is tough resistance ahead admittedly and that area may attract seller again but right now I have to think that buyers are still in control. WIth that said, however, look for some stops below the 100 hour MA (at 1781) and better stops below the 200 hour MA and 38.2% (at 1773). These levels have proven they can attract buyers against them. They should attract sellers through them if they start to overwhelm the buyers.