
You just can’t beat it. In this day and age should markets still go potty over one data release? Who cares, they do and they love it. It’s a lottery and always has been. It doesn’t matter what economic climate we’re in NFP is always the big one.
The important issue is always what the number means not what it is. In this climate it means changing expectations of a Fed taper. I think that question is more important to the market than what it means in real terms to the US economy.
Expectations are for around +180-185k from the major news calendars but the estimates range from 140-200k. If we get another bumper 200k+ then the Dectaper will come right back into favour. The unemployment rate is expected to fall to 7.2% from 7.3% but this will be judged, as it always is, with the participation rate which was at 62.8% in October. If the unemployment rate falls with the participation rate going up this will be extra bullish. As it is, it’s pretty hard to see it reversing in any meaningful way looking at it’s long term picture, but as we know nothing goes moves in one direction forever.
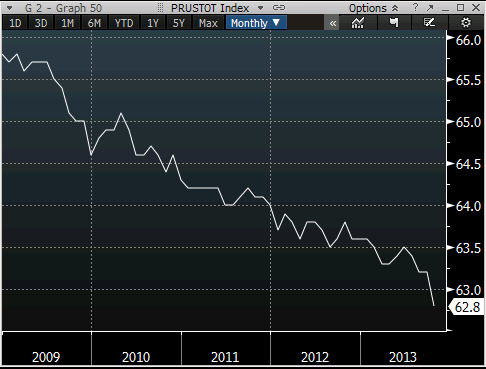
US NFP participation rate 06 12 2013
A fall in the unemployment rate with a fall in participation will likely take any shine off a decent headline number.
We’ve not had a negative print since October 2010 and this is something that is largely overlooked.
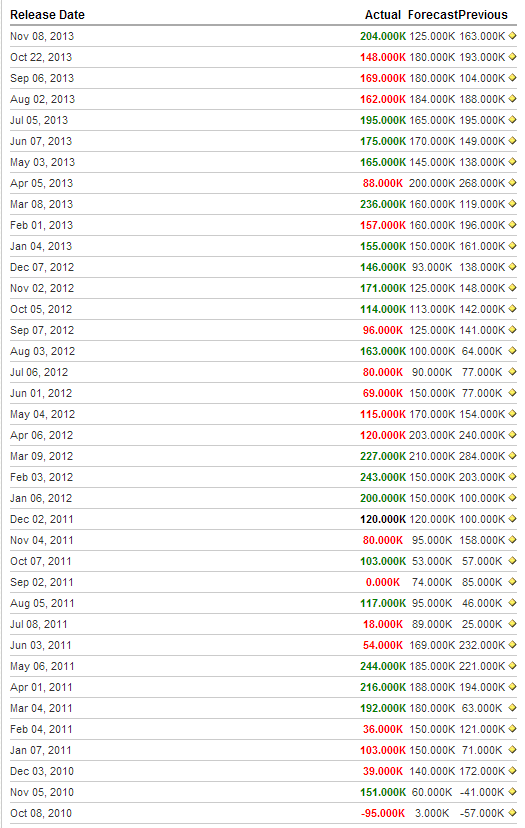
US NFP scores on the doors 06 12 2013
Despite the market moves on missing or beating the expected number the US has been adding jobs consistently for over 3 years. We’ve also seen jobless claims fall over the year. It all paints a positive picture doesn’t it? We’ve been constantly keeping a close eye on the employment components of various PMI’s and other data points and while they confirm an expansion the numbers have been falling. There also still seems to be a big disparity between the econ data and the feeling on the streets. It’s almost like parallel universes.
Does the market care though? Not really. The bone they are interested in is the taper and interest rates movements and as traders we have to focus on that as well despite how we feel about the truth behind the numbers.
I’ve a feeling that a lot of the rises in USD/JPY recently have been with the taper in mind as the dollar has been mixed elsewhere. If we get a bad set of numbers then the buck will wipe a December taper out which could give us some better entry points to start scaling in to next years taper excitement.
As always I’ll be looking for the points either side of any moves that may mark the extremities of any moves. It’s very hard to trade the figure on release so trading some fade is my usual play. In USD/JPY I’m looking at the 103.70 area, being the 2013 high and the 101.50 and 100.50 areas down below.
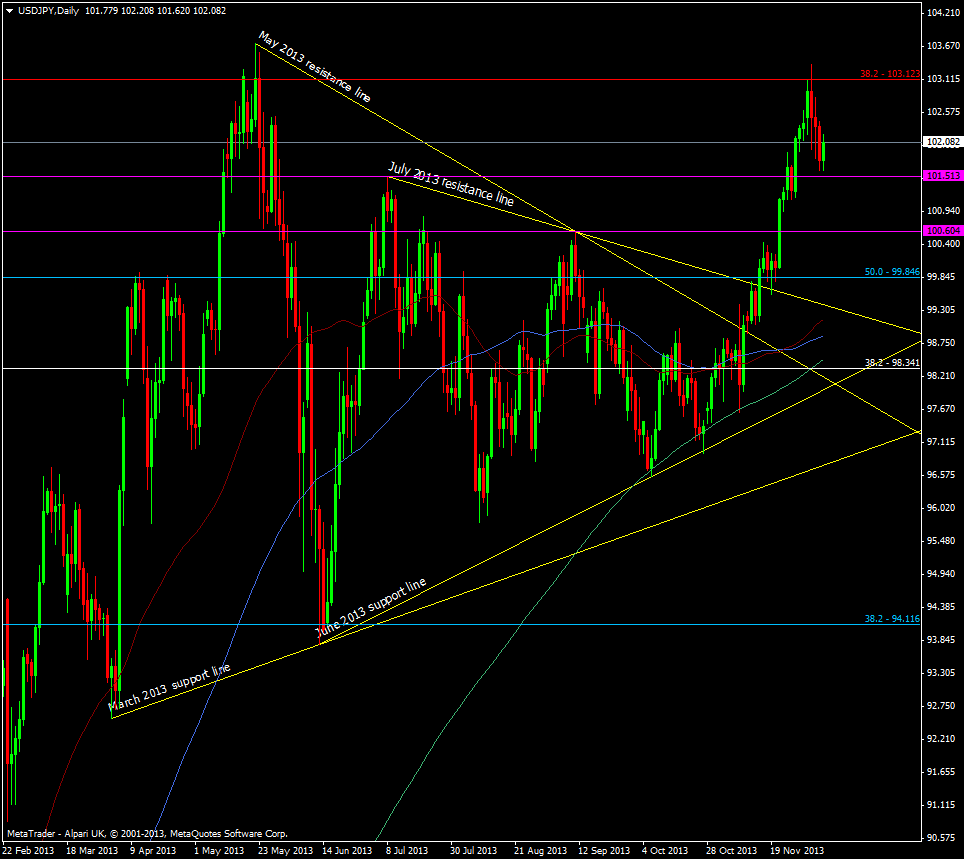
USD/JPY daily chart 06 12 2013
EUR/USD could push up to the highs and I would be looking at 1.3800 as a first point of resistance and 1.3525/30 for the first line of support with the extreme being 1.3500.
Cable may find resistance at 1.6500 on a big move but there’s little in the way until 1.6543 and then the August 2011 highs around 1.6615/20. Below 1.6250/55 will be an area to watch then the broken April 2011 resistance line at 1.6175.
A general rule of thumb is that you can give a 150-200 pip boundary any side of current prices to fade a move dependant on the numbers.
So best of luck to everyone trading over the figure. Stay nimble and we’ll bring our lowdown on the numbers as fast as our little pinkies can type them.

