
Our last GT of 2013 sees reader Chase in the hotseat. London based, and a part time trader (not that you’d know it from the amount of comments he posts on here
), he’s going to kick us off with his views on the Aussie.
I’m sure you’ll all join us in giving him a warm welcome.
Introduction
Name:
Chase Richards

Chase “Top Gun” Richards
Occupation:
Digital Marketing. Specifically, I’m the guy who figures out exactly the right combination of headlines, copy, colours and imagery that will make you more likely to click that “Buy Now” button.
Trading experience:
Trading with my own funds since October 2012. Back in South Africa I also enjoyed some success investing in equities, and I should probably check on those.
Why you started trading:
I was attracted to the potential for making a little something on the side, but also by the analytical challenge. I really enjoy using a different part of my brain than most other parts of my life require.
Trading platforms/chart systems:
For charting I use FXCM’s Marketscope 2.0. For trading I have accounts with Oanda and FXCM. The Oanda account is my traditional trading account, as the position sizing they allow lets me be as flexible as I want in my risk management. I use the FXCM account as more of a sandbox to test out a slightly more aggressive type of money management, which I’ll get to later in the week.
My trading set up and Manstation:

Chase – “The only thing missing is a ForexLive mug”
Methodology:
I’m mostly a medium-term trader, (between a day and a week in duration). My approach is based on very simple analysis – trend lines, fibs, horizontal support and resistance, and moving averages , as well as fundamentals. I spend most of my time looking at 4Hr charts, using the 1Hr time frame for more accurate entries. I don’t use a lot of indicators.
I will occasionally put in some time scalping if the markets are active after work, but usually only for very small money since it’s definitely not my specialty.
Time zones:
Since I’m based in London and have a day job, I usually trade the late US/Early Asian sessions. I keep half an eye on price action the rest of the time during smoke breaks, but will rarely put on trades during this time.
Trades I’m in:
- USD/JPY long from 102.50, target 105.00,
- AUD/USD short from 0.9110, target 0.8860,
- EUR/CAD short from 1.46125, target 1.4300,
- GBP/USD short from 1.637, target 1.6225
Trades I’ll be looking at for the week:
- Australian dollar across most of its pairings, especially against USD, Sterling and the Euro – looking for the best opportunity to sell strength.
- GBP/USD – will observe price action if we get to 1.6200
- All other majors for their reaction to the FOMC “Dectaper” meeting, with a particular eye on NZD/USD and USD/CAD
- JPY pairs
Hi everybody! I’m Chase, and I’ll be your host for the week. I’m a part time trader, with almost no background in finance or economics – but the way the world generates, exchanges and grows money has been a fascination and passion for me since I was a teenager. Everything I know about the markets I’ve learnt in my spare time, especially from talking to folks in communities like this one right here.
I’ll be looking at one particular currency per day, and hopefully that way I’ll cover most common pairs, and I might even have some useful pearls for those of you who also spend your lunch breaks peeking at charts on your phone.
To start the week off I want to talk about the Australian Dollar, in a wood-for-the-trees kind of way. I’m going to try to give a fresh perspective on the Aussie’s technicals and behaviour across a number of pairs, with a side-serving of fundamentals.
Whenever I’m looking at an Aussie pair, I like to remember a few points:
- The RBA wants it lower (and now we know exactly how low), and they are still easing until proven otherwise
- Australia’s economy is not so hot. We keep getting disappointing numbers, and they just can’t seem to keep up with their much-better-at-rugby neighbours.
BUT
- The Aussie is oversold. It has been technically oversold or neutral for almost as long as I’ve been trading.
- The market is net short, and stops are tight.
- It has far more false breaks than real ones
- Liquidity is thin, and
- The Aussie is a high-yielding currency, so it will attract money that has nowhere better to go in a risk-neutral or positive environment.
All this adds up to a market with a nasty potential for short squeezes – especially against the US Dollar. Which is why I want to take a slightly longer view than I normally apply in my daily analysis.
The place to start is AUD/USD. But by the end of today’s post I want to show why I don’t think this is the best place to look for clues. Here’s the 4hr chart, the way I would typically analyse it (and then some).
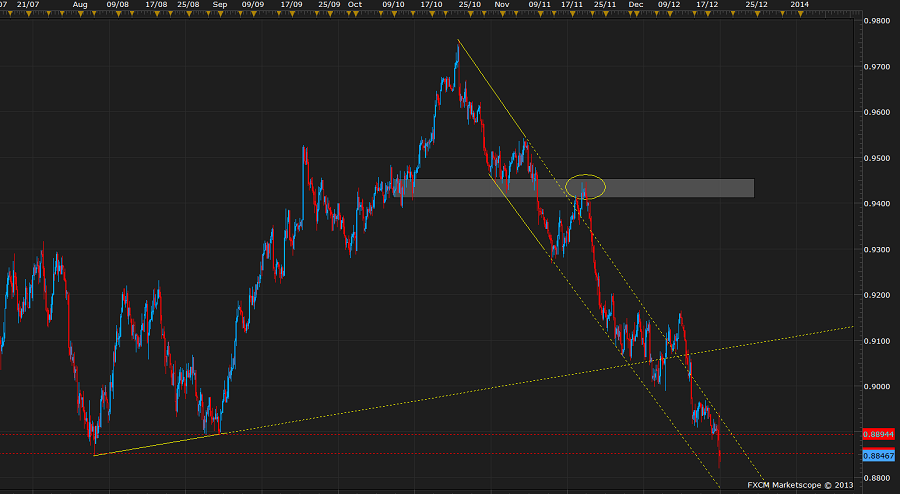
AUD/USD 4hr chart 16 12 2013
Hands up: who’s long?
We’ve got the fibs, we’ve got the moving averages (left on the only two which seem relevant apart from the 100MMA), and the Head-&-Shoulders. We’ve got trend lines and RSI showing divergence – and it’s confusing:
- If we draw a line connecting the first two lower highs after the failure at the 50 fib, we have two false breaks above this channel, each of which ended in lower lows.
- We also had a spike below the trend line connecting the Aug and Sept lows with a close above, followed by a (false) break to the upside (at which point the bulls got really excited) – and look where we ended the week.
There’s a little too much noise here, too many false signs that the trend has turned. And we’ve seen this before in the April to Aug decline.
This is a fact of Aussie trading – because of the currency’s high yield, cash will flow into it. In a low liquidity environment, and on a day when the USD is hurting elsewhere, tight stops will be flushed. That demand will always be there on a day when the sky isn’t falling.
Does this mean you should be long? I don’t think so – almost inevitably you will be in the trade when something like what happened this week goes down. You’ll blink and your profitable long will be in the toilet. Adam summarized this nicely the other day.
The trick, as I see it, is not to try and guess where the market will turn to the pip, but to take a more patient approach. Selling rallies is still the name of the game, but the short squeezes will always seem to go on longer than is rational.
Look for the crazy intraday rally out of nowhere, just because the dollar’s hurting or because some big money is buying. Wait for it to peak, to slam through stops, and that’s when you start getting in. I’ve found that scaling in with a wide stop works more times than not.
That’s just how I approach it. Whenever I try to take a punt on the Aussie with a tight stop, it usually doesn’t work out well.
I sold AUD/USD from 0.9500 to 0.9750, starting in mid-September, with a stop above 0.9900. I entered 5 times, and my 6th order was never hit. I took the last off it at 0.9225, and it was a good trade. But I’d never have had the cojones for it if I’d been staring at hourly charts.
So here’s the weekly.
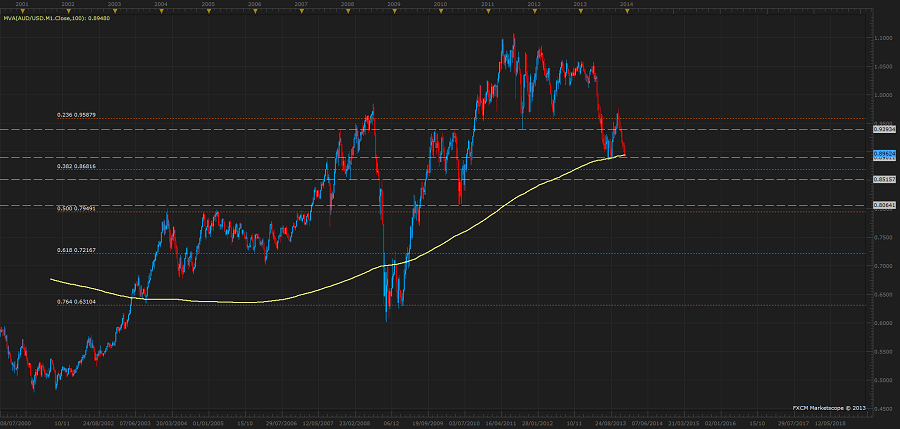
AUD/USD Weekly chart 16 12 2013
Who’s still long?
I’ve drawn in additional supply/demand levels in grey. This little zone we’re in (the much-hyped 100 month moving average) may be the most significant level on the entire chart. A break of this opens up the 38.2% fib of the advance from 2001 to 2011 (at 0.7900), so all of a sudden 0.8500 doesn’t seem so out of the question.
The only problem with using the 100MMA as a support level is that in the last 15 years it has encountered this MA 7 times, and respected it only 3 times. Not the kind of odds I like.
A false break below and close above would be a strong sign of shorts finally capitulating. Would it be time for longs? I doubt it.
Before I move on to some of the crosses I want to put this in some perspective. Here’s AUD/USD with NZD/USD overlaid
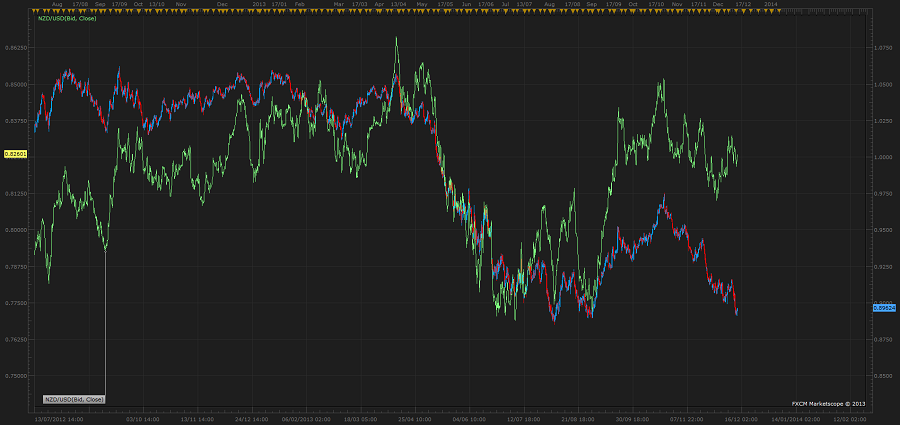
NZD overlay 16 12 2013
I like how this chart clearly shows where the respective central banks’ monetary policies diverged.
Now here it is with EUR/USD overlaid.
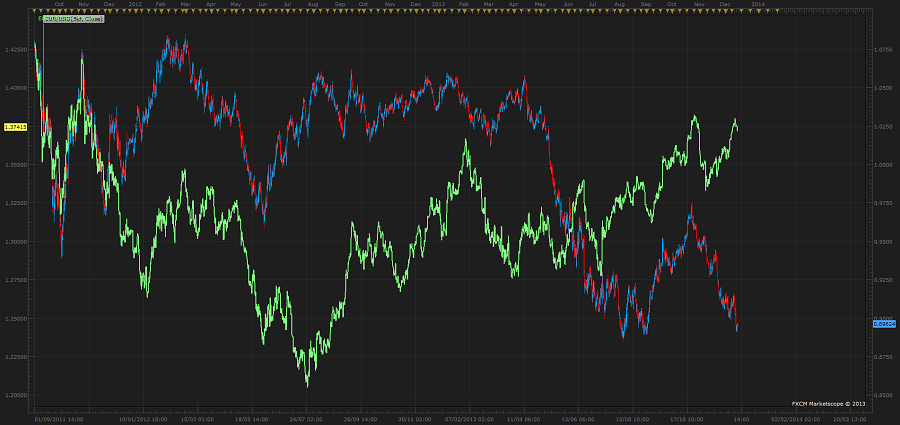
EUR overlay 16 12 2013
Something has gone horribly wrong for Australia.
If we take the Buck out of the equation as much as possible, the Aussie’s performance has been pitiful. Why should the Euro be on its way to the moon, when a much higher-yielding currency is flagging? Because it has a central bank doing a good job of talking it down. And when they’re not flapping their jaws, the numbers will do it for them.
If all it takes for the Aussie to rally is some USD weakness and a lack of bad news, then all it needs for it to fall is anything besides those two things. As we saw on Friday 6th Dec – even good news can’t spark a rally, and that’s a bad sign.
I want to have a quick look at the crosses to wrap up. I’m already keen on selling some Aussie dollars, but I want to find the best place to do it.
EUR/AUD and GBP/AUD
Here’s EUR/AUD H4, with GBP/AUD overlaid in green. Sorry if that’s confusing, but I wanted to show one important thing: the Euro and the Pound are not in the driver’s seat here.
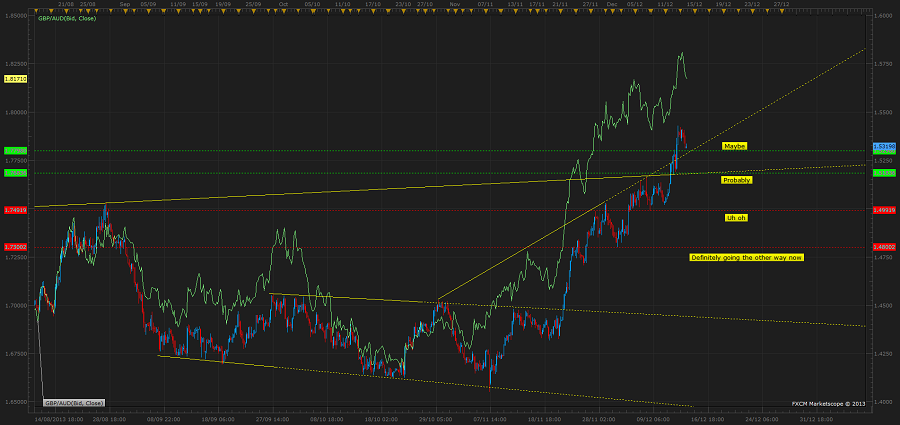
EURAUD with GBPAUD overlay h4 16 12 2013
The break of the channel at 1.4500 gave us a clear target of 1.500 or higher. We got there in a week, barely stopping for gas along the way. Only GBP/AUD put in a bigger gain, since Sterling was the flavour of the week at the time.
The Trade:
1.5200 looks attractive for longs, since it won’t take much time to find out if the break is for real. If price heads well below 1.5000, then we’re probably in for a deeper correction.
These moves were helped along by Euro and Sterling gains, but what really moved them is the steady decline of the Aussie, which is magnified against a very strong partner. The takeaway is that if you really want to profit from Aussie weakness, do it by selling it against a currency that is displaying strength. That counts the Buck and the Yen out.
When trading these crosses, it’s important to remember what is likely to move them. I tried to put this in a table but lack the data visualization skills, so to summarize:
Pure USD Move
- AUD likely to fall more than EUR or GBP on USD strength, pushing the crosses higher
- USD weakness with little independent action in EUR, GBP or AUD usually sends these pairs lower
GBP or EUR-based Move
- Effect on crosses often temporary, or corrected violently. An extremely strong Euro or Pound can force AUD longs to bail through cross action, but this is rare.
- While AUD weakness continues, weakness from the Euro or Pound can create buying opportunities in the crosses
Pure AUD move
- Just get out of the way. An AUD/USD rally of 50 pips on good data can translate to a 150+ pip plunge in GBP/AUD in less than an hour. If you’re not on the right side of it already, it’s probably too late. This is also why breakouts tend to have slightly higher rates of follow through – provided they’re in the direction of the trend.
All that being said, I like these two pairs the best for playing Aussie weakness. It’s just a question of where a pullback will stop…
AUD/CAD
I’ve stayed away from this one because of my other exposure to CAD, but it presents an interesting technical picture. Here’s a very long term and fairly messy daily chart:
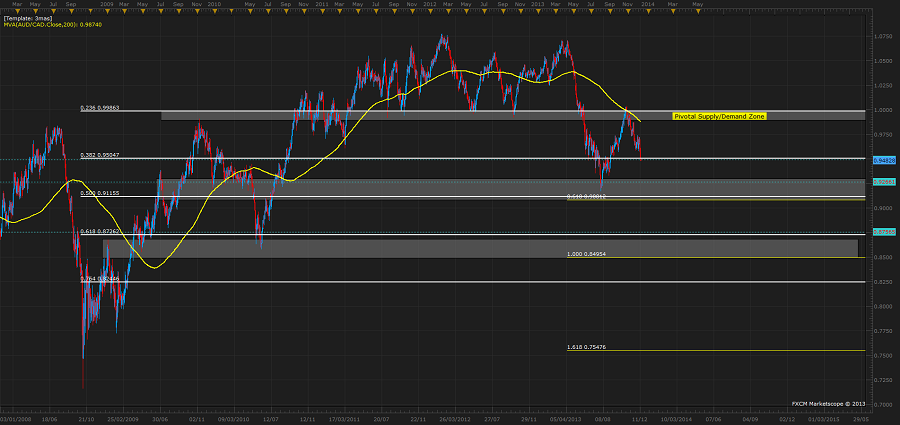
AUDCAD daily chart 16 12 2013
Zooming in a little, we see a clear rejection at former long-term support. Rallies into the channel top should be sold according to my strategy, since a clear trend with established boundaries is present.
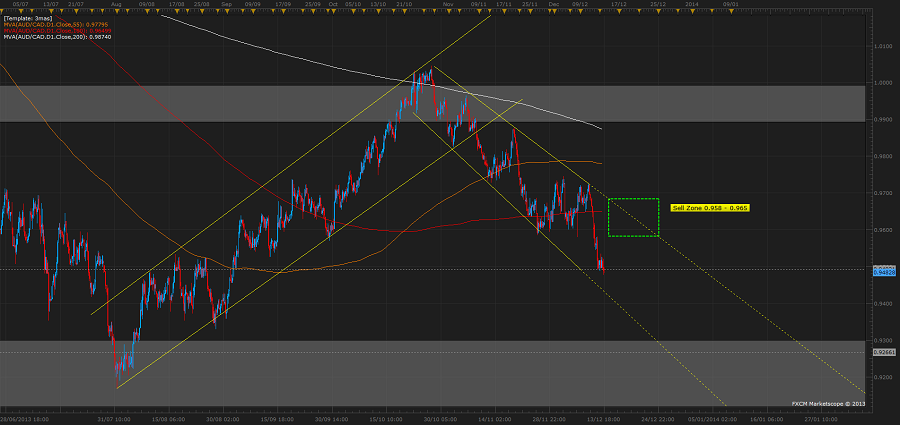
AUDCAD 4hr chart 16 12 2013
The Trade:
Shorts from 0.9600 are attractive, against 0.9760, and looking for at least 0.9250 as a first target, 0.900 as a second and 0.8700 for extra sugar.
I quite like this one, provided we see some signs of life from the Loonie.
AUD/CHF I’m going to leave for now, because it is terrifying. If anyone trades this pair, I’d love to hear your thoughts.
And I thought I’d leave the elephant in the room until last:
AUD/JPY
4 Hr chart:
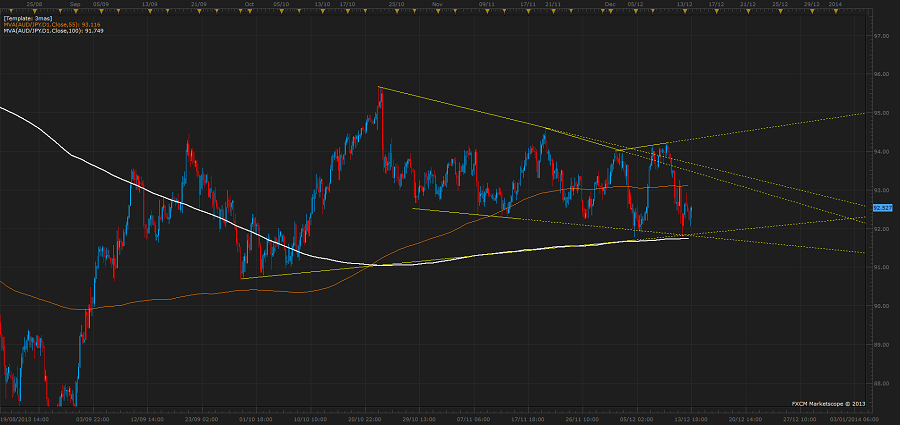
AUDJPY 4hr 16 12 2013
This one is at the mercy of Yen traders, but I’m not all that keen on it in either direction. If you’re playing Yen weakness, then you don’t want to be doing it with the weakest hand. Buy EUR/JPY or GBP/JPY instead.
If you want to play Aussie weakness, don’t do it where a weakening Yen could derail your trade. This is one of the few JPY pairs to not break out of consolidation yet, but it could do so easily if the Nikkei pushes higher.
The Trade:
The only good trade here, as I see it, is a simultaneous JPY rally and AUD rout. A break below the wedge bottom/100DMA, and a subsequent retest of and failure at this level, combined with a reversal in the other Yen pairs, would make this an excellent medium term short. I’m not expecting that to happen this week.
What I’m looking for is:
- A solid break below 91.80, on a daily closing basis with some serious commitment.
- Confirmation from the Nikkei – if Japanese stocks aren’t in the gutter, I’m not interested
- Confirmation from the other Yen crosses – the current breakouts turning false would do it
- At least some indication that the Aussie had broken significant support
If all those stars line up, I like selling AUD/JPY against 92.50, targeting 90.120 initially and then 88.00. If it proves to be a false break lower, I want to be out of the trade as soon as possible, so will keep a tight stop on it.
And that’s all for today folks! The Aussie isn’t the only currency I’ll be looking at this week – next up we’ll have the Yen, the Pound, the Swissy and maybe even a bit of Loonie time. If anyone has their own take on these pairs, let’s hear it J
Chase

