
We’re approaching 300 pips for the day and that usually puts us into “stretched” territory but with USD/JPY still looking weak we may see a bit more yet. In case we get another move I’ll write this but first then add to it after posting.
With cable taking a fall through the lows and heading to 1.63 and USD/JPY to 101 there may be a good risk reward in in picking up longs in one or all three at those levels. We should see support in both USD/JPY and cable at the big numbers and the bang for your buck may be in GBP/JPY if the majors hit those numbers. I’m going to be looking at all three for a longs if we get there.
164.76 represents the 50 fib of the Oct lo/hi. The month isn’t starting in the greatest of fashions falling below the 100 mma after spending two months above.
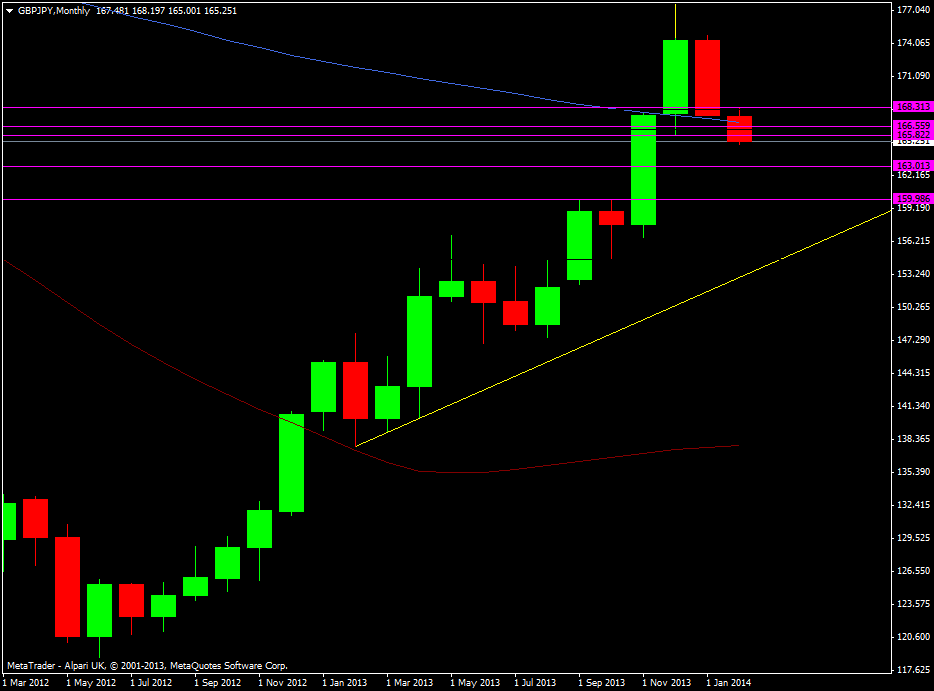
GBP/JPY monthly chart 03 02 2014
Under there we have the 100 dma at 163.89 ahead of the 163 level which marked the 2009 double top and whose break proved so decisive. Either side of that we have possible support and resistance levels at 163.50 and 161.75 and in between the 61.8 fib at 162.39. Then we have the Feb 2013 support line at 160.66.
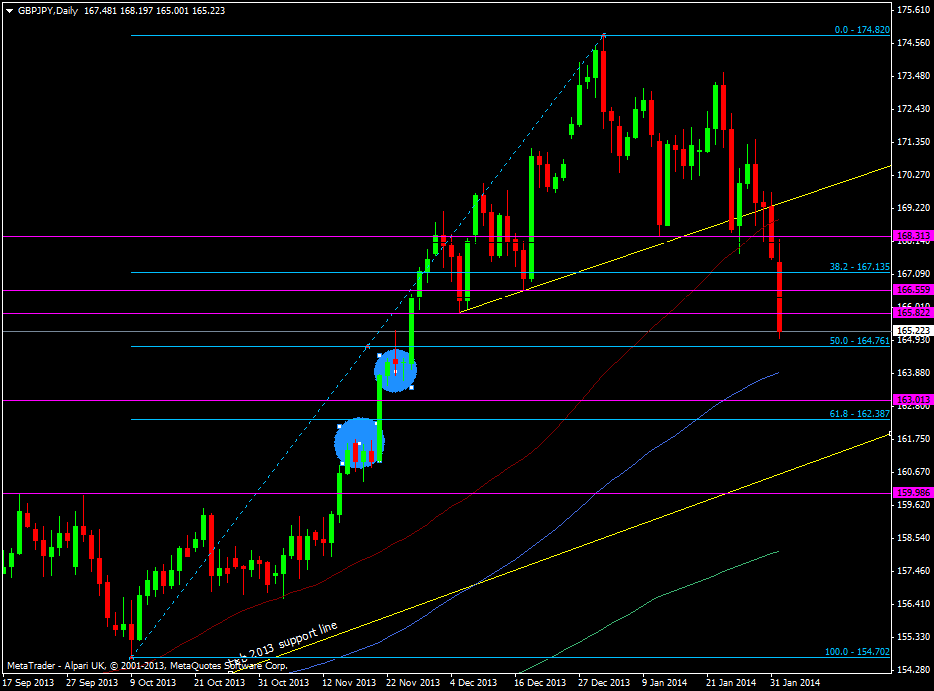
GBP/JPY daily chart 03 02 2014
We’re off nearly 1000 pips from the 174.82 highs so that in itself suggests that the current move could be overdone. The caveat is that we’ve also come a very long way and a correction has been long overdue. As we know the cross is more open to 100+ pip moves so we could well see us nearer 163 and that will be a good test to see if the rally will kick back in. A failure and we’ll be sub 163 pretty sharply.

