
Guest Trader day 4 sees Steven (that’s Steven, not me
) rueing pulling out of a profitable trade too early and joining the long long list of us who sometimes just get it horribly wrong.
Catch his other posts this week here
Aim for the mountain not the molehill
Welcome back everyone. Only today and tomorrow left so I’ll get right to it. Today we’ll see how my two past trades played out and I’ll debrief you on what they contributed to my trading style. A couple of you supported my trades and few of you thought me idiotic; let’s see who was right.
Long GBP/JPY
This first chart is the one from yesterday and below that is what happened.
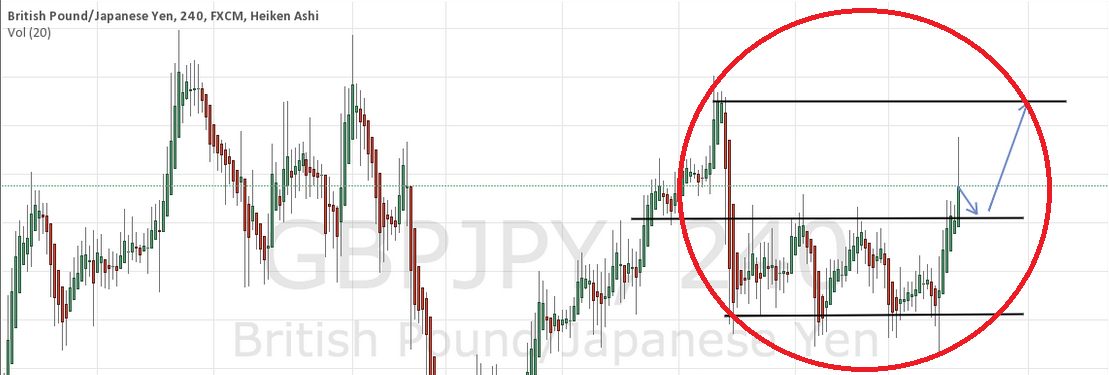
GBP/JPY 1
Chart 2
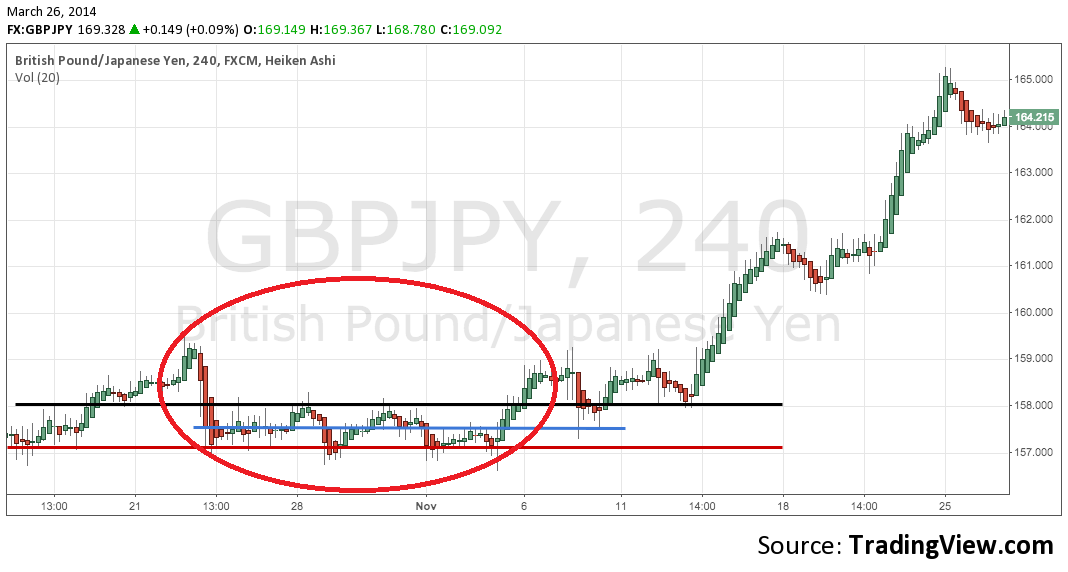
GBP/JPY 2
Boom! Talk about nailing it. This was last October/November and the break of the top of the range marked the beginning of a 1,000 pip run up. That makes me lord of the trading universe, yes? No. I took profits about 100-150 pips into the trade, which left a massive amount of money on the table. In fact, I stupidly tried to time a pull back or two and gave a lot of that profit back. Consider my actions here a case study in how not to trade.
- I made a prediction and it panned out. That I started to jump almost immediately back in is a rookie mistake. The right play is to step back, take a breath, and reevaluate the cross as if I hadn’t just made a trade, as if I’d just looked at the pair for the firs time ever. I learned that trader’s need a short memory. I learned to forget my wins as fast as I cut my losses.
- Multiple failures at round numbers are powerful indicators. For those of you who like to play the pullbacks or picks tops or bottoms, or anyone trying to figure out where the safest stop level the smartest profit level, i.e., the one most likely to be hit is, few pieces of price action are more powerful than multiple failures at a big round and therefore psychological number.
- I left so much profit on the table here. So, so, so much missed cash. That suggested to me that I needed to improve how I evaluate the potential magnitude of a trade. My data distillation chart was born out of this. (The data distillation chart and the theory behind it is the topic of my final post tomorrow. It will be longer but you can’t complain because you’ll have all weekend to read it. Plus today’s is short, so there.)
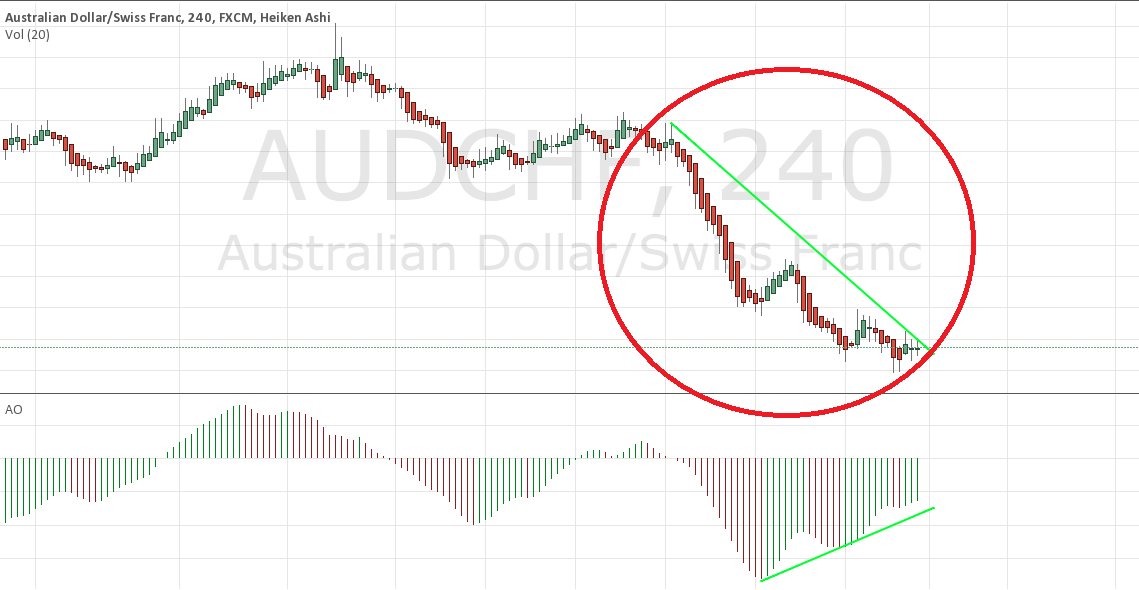
Long AUD/CHF
Chart 1
AUD/CHF 1
Chart 2
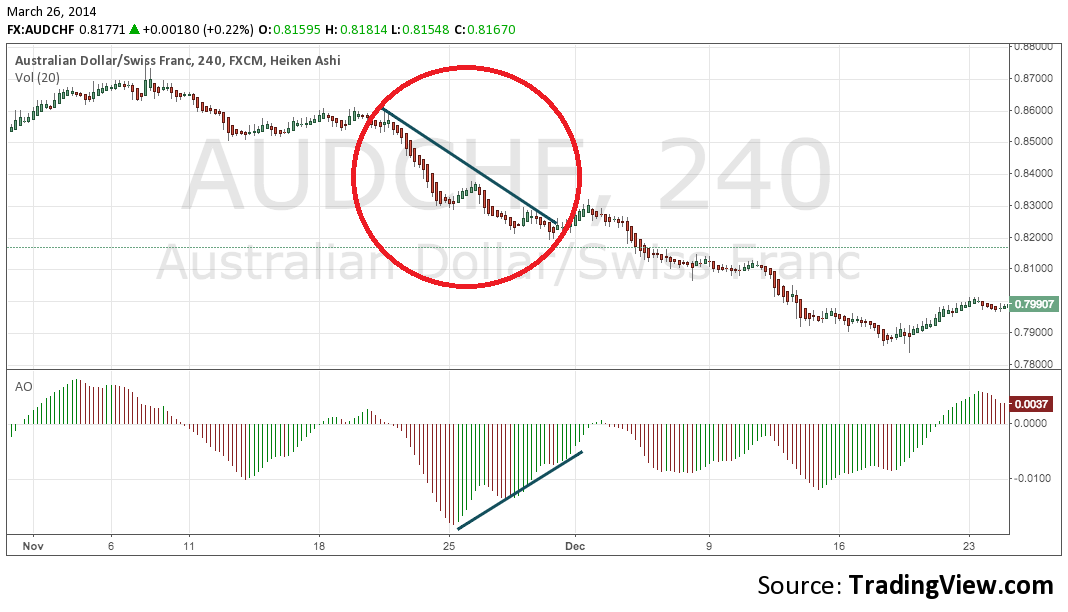
AUD/CHF 2
It’s hard to be as wrong as I was on this one and that’s impressive, which is what I told myself just before I threw my laptop off my dock. I lost 100 pips on this one. My goal was far too optimistic and, let’s be serious, who cares where I put the stop it was probably getting smashed to bits. Wrong all over the place.
- My reliance on technicals and especially on my favorite piece of technical analysis (Convergence/Divergence) had become a crutch rather than one tool of many in a box. I favor relatively clean charts where most of the marks are lines I’ve drawn myself to understand what the price action was trying clue me into. It’s easy to fall into dependency on indicators and other pillars of technical analysis. It is important to remember they are far from perfect and are often taken advantage of by big banks or institutional savvy traders. When I was on the equity trading desk we took pleasure in blowing up some obviously short-term Fibonacci trades. Again, they are the materials not the finished product. To rant on this for just one more second: why is it traders love to treat 55, 100, 200 day moving averages as if they are insurmountable walls. An average by definition is smack dab in the middle of a range. The middle, not the top or bottom. I grant their usefulness as a single piece of information and use them that way myself but c’mon don’t place your stops on or infinitesimally below the squiggly average line. Give yourself some breathing room.
- The most important thing this trade taught me is to never fight the trend. Again, you scalpers are cowboys and god bless you. I just can’t do that. I prefer to find a strong trend (CHF dominance over the AUD in this case) and wait until the weaker pair has made a run so I can bet on the resumption of a strong trend (which is the opposite of what I did here…which is why I got pummeled).
Tomorrow’s final post will focus on data distillation (think data journalism of the “538” variety adapted to trading/finance). See you in the comments section.

