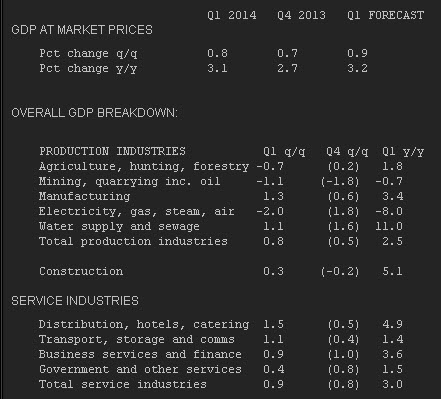
- +0.7% prev
- y/y + 3.1% vs 3.2% exp vs +2.7% prev
- index of services Feb m/m +0.2% vs +0.3% exp vs +0.3% prev revised down from +0.4%
- q/q +0.9% as exp/prev
Lower than expected and we’ve tested the 1.6800 support I mentioned from 1.6835. Currently 1.6810
Let’s see if we get any second wave selling to squeeze some longs. If not we have to accept its bid still

UK Q1 GDP table

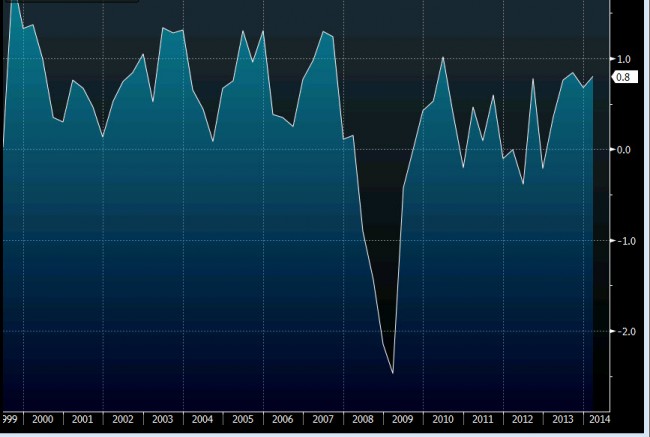
UK Q1 GDP qq chart


