
We’ve nicked a new low in cable at 1.6933 as sellers step in to keep the pressure on after topping 1.70.
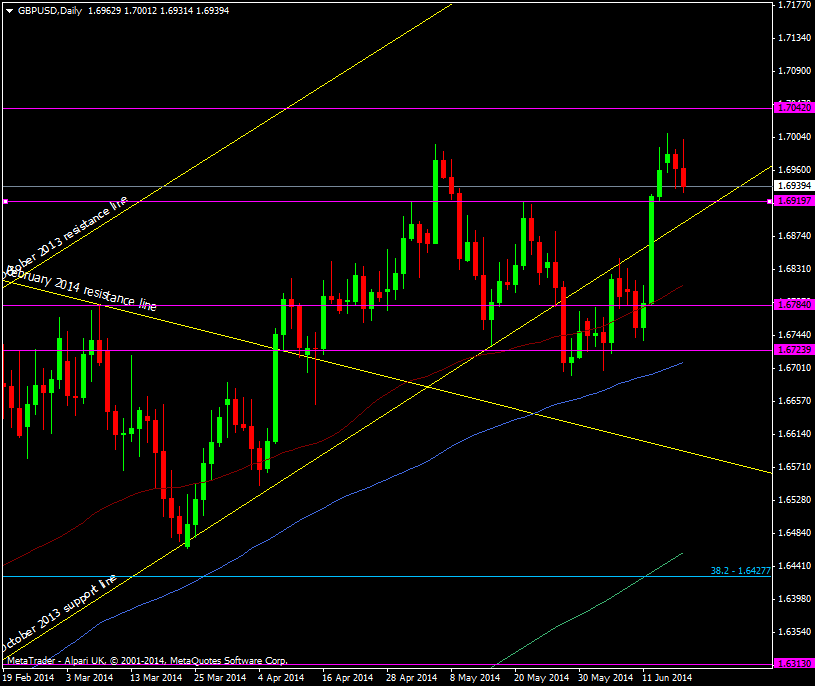
GBP/USD daily chart 18 06 2014
1.6920 remains the first decent level of support before hitting the Oct 2013 trendline at 1.6900 and 38.2 fib of the 11 June swing up at 1.6905. From there it’s 1.6880 and 1.6840 as the next tech support levels.
1.70 is still showing enough resistance to knock back the buyers.
EUR/GBP is still finding it tough to crack 0.8010 and if it goes then that may be enough to help cable lower.

