
Who remembers when cable used to hover around a big level then smash it to bits? For example, one minute we’d be trading 1.6980, the next 1.70 would go and we’d be trading 1.71 in a flash as all hell broke loose.
I miss those days.
At the moment the old girl is managing to hold above 1.70 which should at least give it a base for a solid move up.
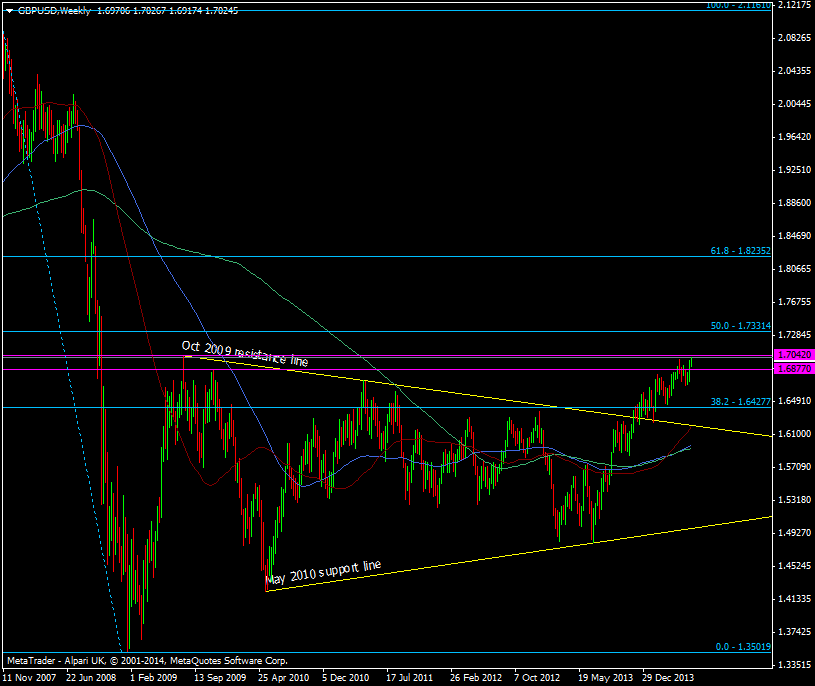
GBP/USD weekly chart 19 06 2014
There’s been no big stop run which either suggests they are higher up or small in size. The 2009 high is an area a lot of the big banks have been watching as it is either a stop point or profit point for some.
If we surpass that level then technically we’re clear until the 50 fib at 1.7331

