
Try as it might we can’t get over the 0.9400 hurdle and make it count. Anywhere between 0.9400 and 0.9445 has seen the sellers come in and bat it back down again and as time ticks on the chances of testing the lower end of the range increases.
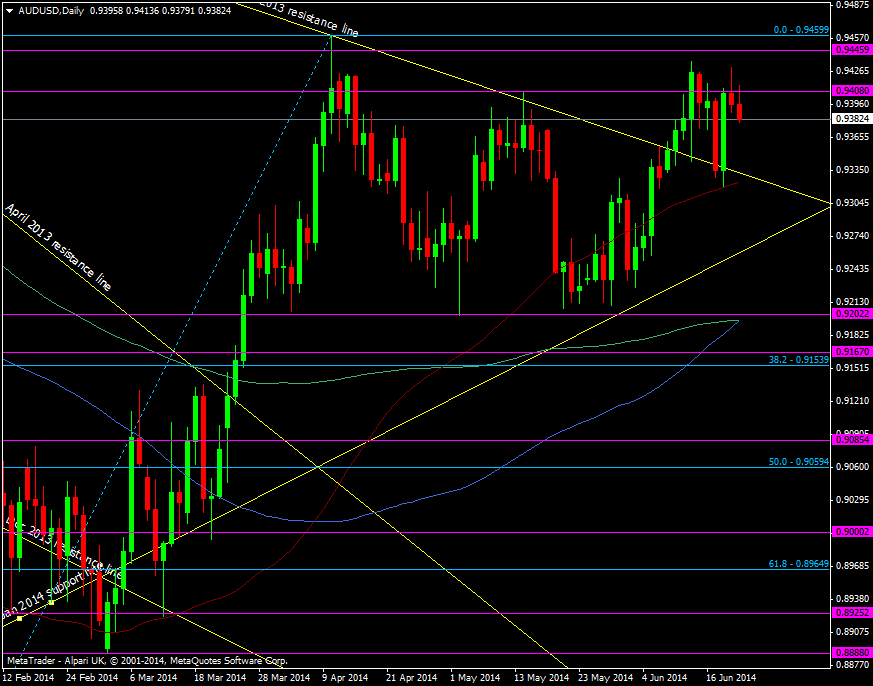
AUD/USD daily chart 20 06 2014
The first target for a fall would be the broken Oct 2013 resistance line and 55 dma at 0.9324/30. Under there Jan support at 0.9259 awaits an then we have the strong 0.9200 level which also has the 200 & 100 dma converging at 0.9197.
Once this pair gets in a rut it likes to range between the goal posts and that’s what it’s doing here. I’ve done what I had been itching to do for a while and offloaded some of my longs on this last break of 0.9400. I’m very much liking the look of the 0.9200 level as a strong technical level so I’ll be keeping a close eye for loading up some more longs down there.
Try as they might aussie bulls just can’t hold on to 0.94

