
- May US core PCE inflation 1.5% vs 1.5% exp y/y
- Prior 1.4%
- 0.2% vs 0.2% exp m/m. Prior 0.2%
- PCE 1.8% vs 1.8% exp y/y. Prior 1.6%
- 0.2% vs 0.3% exp m/m. Prior 0.2%
- Personal incomes 0.4% vs 0.4% exp m/m. Prior 0.3%
- Personal spending 0.2% vs 0.4% exp m/m. Prior -0.1%
Bang on expectations except for most notably in personal spending. 0.4% isn’t much to crow about in incomes but spending shows that maybe money is still tighter in the pocket than the market thinks.
On inflation, we have confirmation of a slight rise in the core and the headline number is the biggest jump since Oct 2012. Maybe not enough to give the inflation watchers much to chew on. Higher energy and food costs will be a big driver of the headline number. Food was up 2.1% from 1.3% prior for the month while energy rose 5.8% from 5.2%
USD/JPY broke below the 200-day moving average to as low as 101.49 after the report. Stocks and Treasuries were also hit by a rapid ‘risk off’ trade.
Amongst the numbers wages led the way matching the numbers from the headline while disposable incomes remained unchanged at 0.4%
In consumption durables turned around a -0.9% in April to post +1.0% but non-durables and services suffered slight losses -0.35 from -0.1 & -0.2% from -0.1% respectively
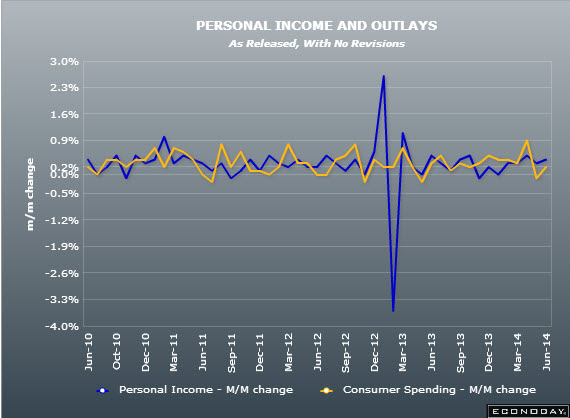
US personal income/spending 26 06 2014
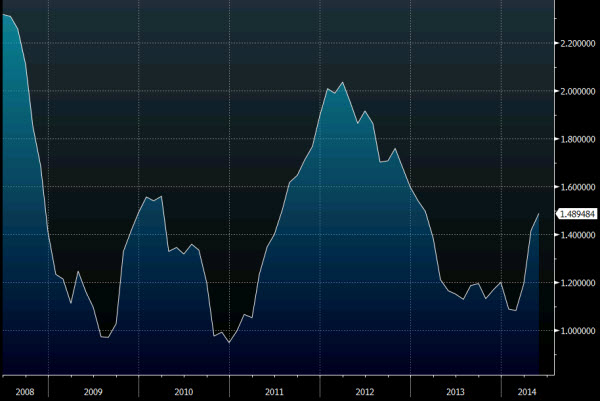
US core PCE inflation 26 06 2014
In the wake of the report, Barclays lowered its second quarter GDP estimate to 2.9% from 4.0% and Goldman to 3.5% from 4.0%.

