
The here and now of technical analysis is very important but we can sometimes get too caught up in the short term outlook, and that means we can miss things from the bigger picture.
Unfortunately the majority of trading platforms don’t have sufficient historical data to enable us to take that view. Never fear though as we at ForexLive have got you covered.
The latest break higher brings the July 2011 high into view at 0.8840
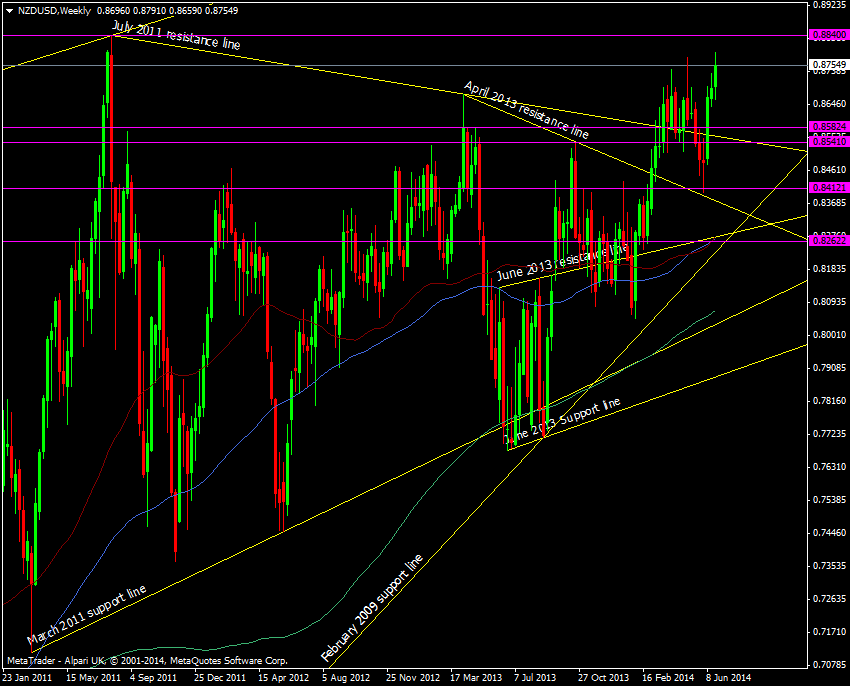
NZD/USD weekly chart 27 06 2014
That in itself is a fairly big level as it opens the door for a potentially very large move.
Looking at the yearly chart going back 40 years we have a big old fib level at 0.9400
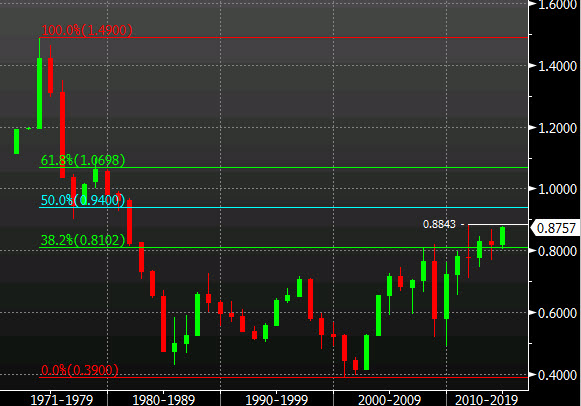
NZD/USD yearly chart 27 06 2014
If you traded against the prior 38.2 fib it would have yielded you some massive returns.
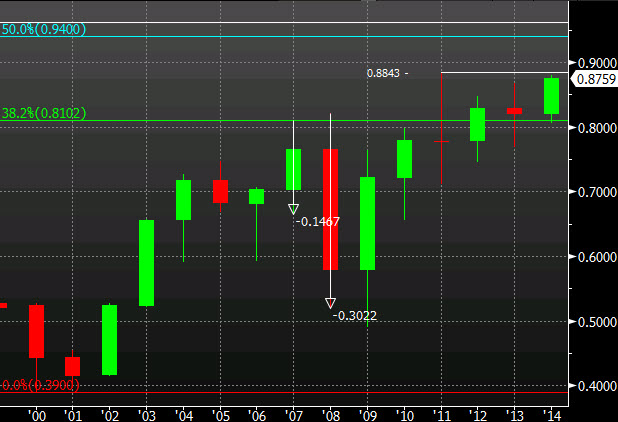
NZD/USD 2007 & 2008 returns
Give or take the value of a few sheep we are 650 points away from the big 50.0 fib at 0.9400 and these are the types of big technical levels I love. Those of you who remember, I highlighted some long term fibs on the big USD/JPY move up from the 75’s. They yielded around 400 pips each and there were 3 of them (if I recall correctly). The big technical levels are worth looking out for.
From a technical standpoint it’s one of those dream levels that come around rarely. Trading big levels like this comes with plenty of warnings. For one they very rarely stop on a dime, so you have to give yourself plenty of room in the trade. From experience you need to look to give yourself at least 100-200 pips leeway. Part of the reason for that is that you have to also judge the conditions at the time, for example,
- How strong is the move?
- What are the reasons behind the move?
- What are the risks for the trade?
These all need to be taken into account before hitting the button and you have to be prepared to see some red on the trade for a fairly long time. It’s easy to look at the charts above and think “yeah, that 3022 pip gain looks a doddle” but in reality it may have been a few months before you started to see the trade turn a profit (in this case -112 odd pips), whilst worrying whether it would, and then you would have had to plan your exit points, so there would be no guarantee you would have taken every pip in the move.
That’s all part of the psychology of trading though and what makes it difficult to ride out a really big move and still, at the end of the day there are no guarantees that it will pay out.
So what good news have we got going for us on a trade against that fib? For one the RBNZ is still in rate rise mode and the US is still far from raising rates themselves. That at least could be enough to run us up to the level. After that we may be at the end of the tightening phase in New Zealand and the US could be centre stage. The Kiwi’s will also not want the currency that high but would have been virtually powerless to do a thing about it while they were raising rates.
So there’s enough simple factors to give a possible green light to the trade and that is enough to confirm having a crack at it. I need to keep watch on the fundamentals in the run up to make sure that they still conform to the strategy and if they do then it’s chocks away. There’s a lot going to be going on and a long way to go in the meantime, but it’s one for the backburner and worth keeping an eye on

