
The big fall from above 1.0900 has had a virtually clear run tech wise but we’re coming into some resistance levels now and that might slow things down for the time being.
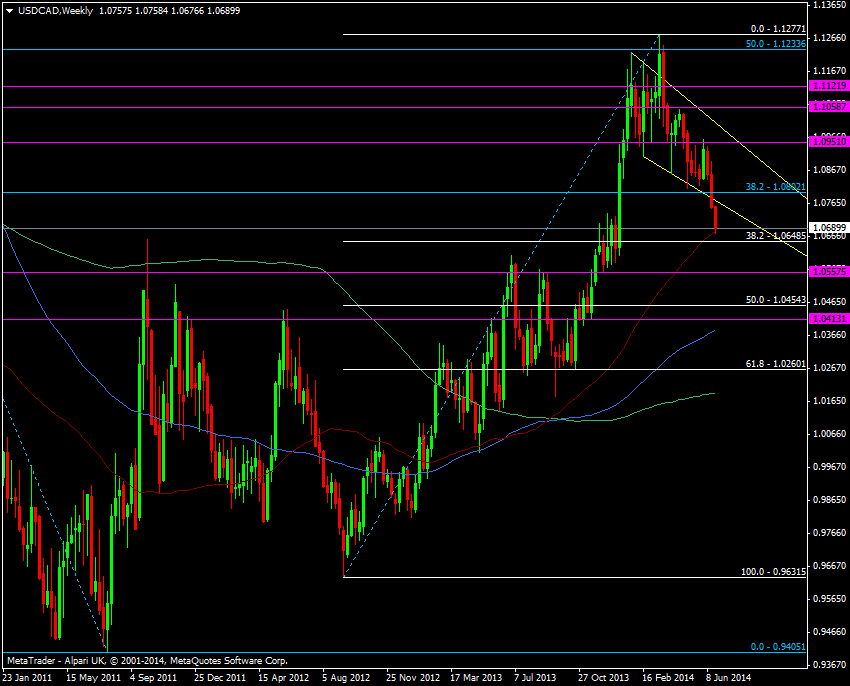
USD/CAD weekly chart 27 06 2014
We grabbed a handful of pips under the 55 wma but that’s where we’ve bounced and the close is going be important. If we hold above as today runs out then there is the potential for a base to be built. Irrespective of that, the 38.2 fib from the Sep 2012 lo/hi at 1.0648 is the next sizable tech level.
Below that is the 100 mma at 1.0588 and that looks safe, for this month at least. The last time we touched that was the break up through 1.0600 in Jan.
We’ve seen resistance come in around the 1.0750 mark and the fact we haven’t tested the broken 2014 channel bottom and 200 dma is likely to increase the strength of resistance there.
This move has been fairly swift and aggressive so it stands to reason we see some consolidation. The 38.2 fib and 55 mma is as good a place as any and I like it enough to test it with a smallish long here.

