
Not a pair I often look at but flicking through my charts I came across an interesting set up in the GBP/AUD pair.
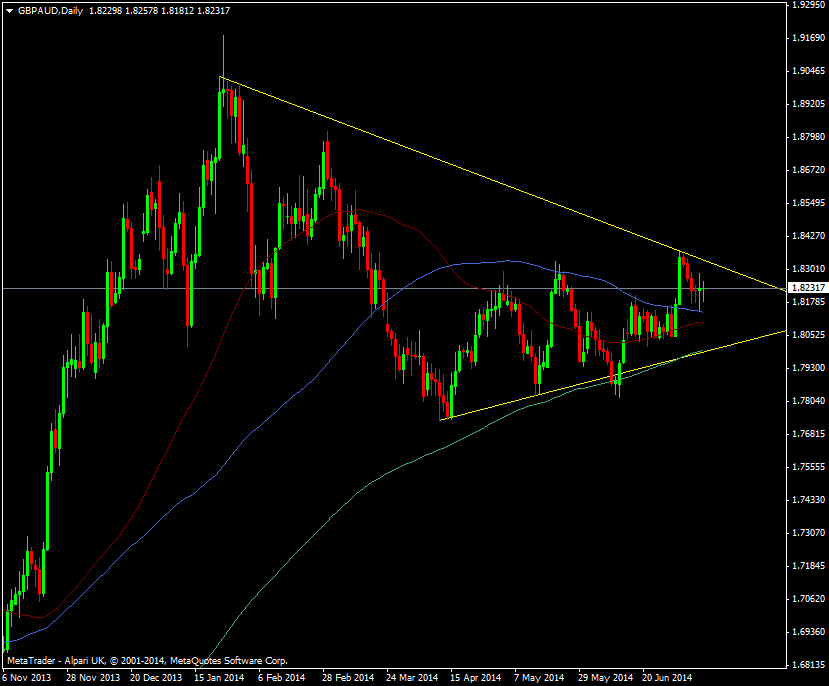
GBP/AUD daily chart 13 07 2014
It’s looking like a good technical trade for a long around the closing 100 & 55 dma’s at 1.8104/40, and adding at the 200 dma and trendline at 1.8000. The 2014 resistance line would be the first profit point I’d look at.
The sensible way to play the downside would be to stop and reverse on a break of the 200 dma looking for at least the April lows at 1.7725, which also contains the 55 wma.

