
With Gold touching a four month high last week it’s prompted some traders to take some money off the table as fears start rising among gold bugs that the Fed may start to lean to the hawkish side.
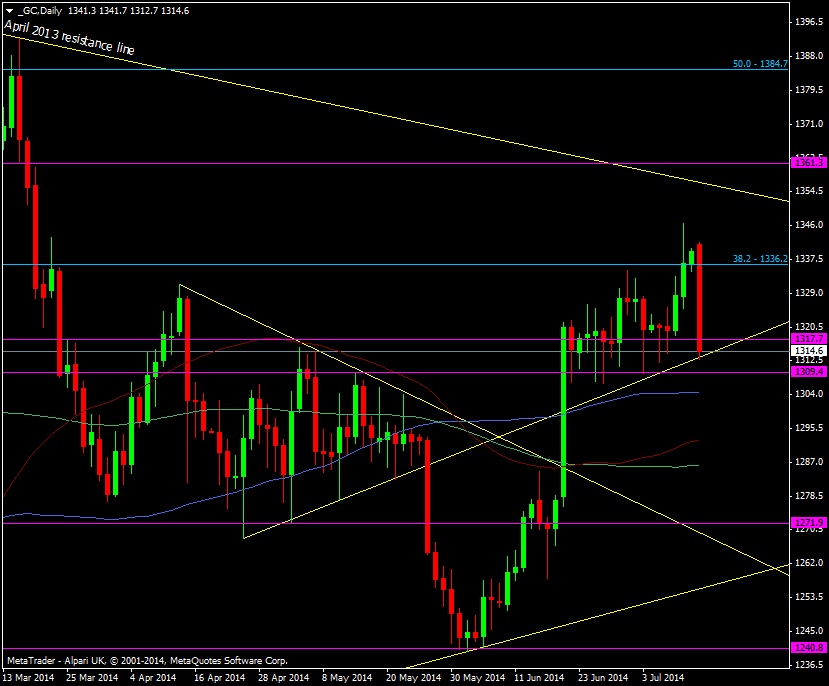
Gold daily chart 14 07 2014
We’re now down to the old support line at 1312 with the previous S&R level at 1309
Even as I type we’ve broken through the support to the 100 dma at 1304
There’s another element of the safety trade coming out of the market too but the move looks strong.

