
68 days ago Socgen were worried that we hadn’t had a 10% correction in the S&P for 468 days.
RBC’s chief US market strategist says it’s been 1020 days since the last one back in 2011.
Someone is fiddling the numbers to fit the cause.
Either way it’s been a long time since we’ve seen any meaningful correction but we are potentially facing the same scenario we encountered back in March and April when we were banging our heads against the 1880/85 level. Funnily enough it’s the 80/85 number that we’re banging our heads on again.
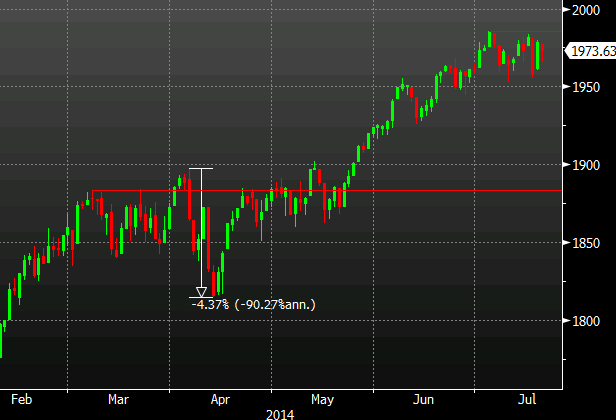
S&P daily chart 22 07 2014
Obviously we shouldn’t expect one pattern to follow another directly but the defense of the big figures has been obvious for the last couple of hundred ticks. Before the break through 1900 we consolidated before trying an attempt which failed resulting in a 4.37% correction.
With 2000 big a hugely psychological level we should pay close attention to price action on an attempt as this could provide a good opportunity to go short just ahead of a test and catch the rejection, and then have the opportunity to get it on a decent dip.
As always, judge any moves on its merits at the time.
In the here and now the S&P has opened up 8 points to 1981 with the Dow +38 to 17090. The Nasdaq is green by 26 at 4451 and you can get 2.47% on 10 year US of A bonds +half a bp, though we have been up through 2.50%

