
The 18 March lows mark a possible last line of defense before a more sustained move lower. We held up at the 61.8 fib of the Jan/Jun lo/hi at 97.56 yesterday but that’s gone now.
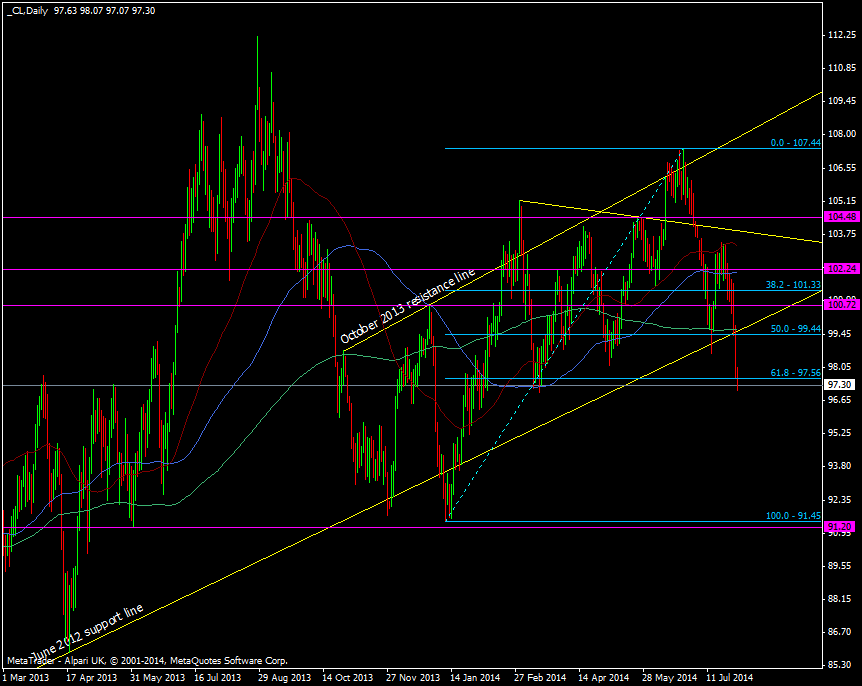
WTI crude daily chart 01 08 2014
97.00has been a historical S&R point and a break has the ability to see a quick run down to 95.00. Much further down the big level is 91.20-91.60 area and one to watch if we run that far. Brent has also broken out of the July range and is testing the October 2013 support line at 104.75. We bounced from a first test but it’s under pressure again. 103 marks an important point before a fall towards the 100 mark.
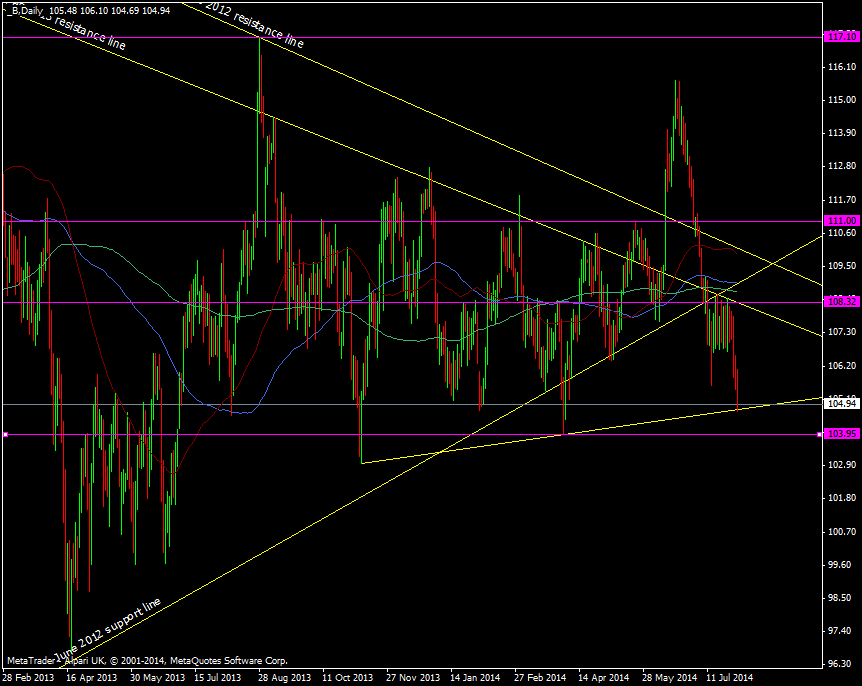
Brent Daily chart 01 08 2014
We’re being driven by demand worries rather than geopolitical fears but they are still bubbling under the surface. I’m going to look to play a small long here in Brent if we hold that support line. If we break then I may look at a short if the line holds on a retest.

