
We’ve matched the lows lows at 1.3317 seen back then and there’s a sizeable line in the sand here at 1.3295. If that goes then the 38.2 fib of the July 2012 swing up is at 1.3248
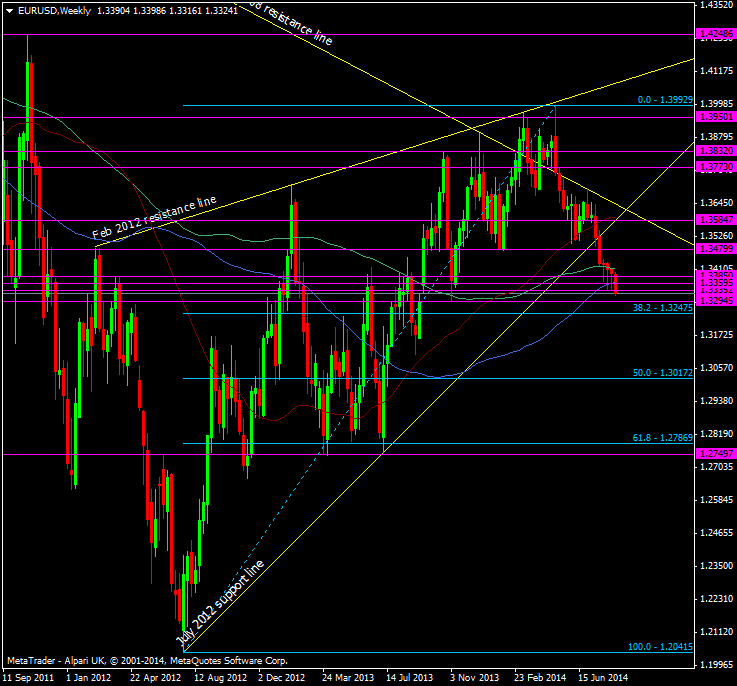
EUR/USD Weekly chart 19 08 2014
There’s another barrier at 1.3300 and it’s likely to stand up better to an attack than 1.3325 and strong bids are there also. There’s bids then at 1.3260 before stronger at 1.3230 and 1.3200
Offers are still strongest up towards 1.3390/40 and we still have the option expiry at 1.3350 which could see a move up in the next 30 minutes

