
Since breaking out of the 101/103 range the buck hasn’t looked back. Dips have been fairly shallow and it’s kept the buyers in control.
At the moment we’re feeling out the recent high at 104.26 and have touched 104.25 so far. There’s enough short term resistance from barriers etc to make the ride to 105 bumpy enough but the dollar still has the bit between its teeth so don’t rule out a quick pop higher.
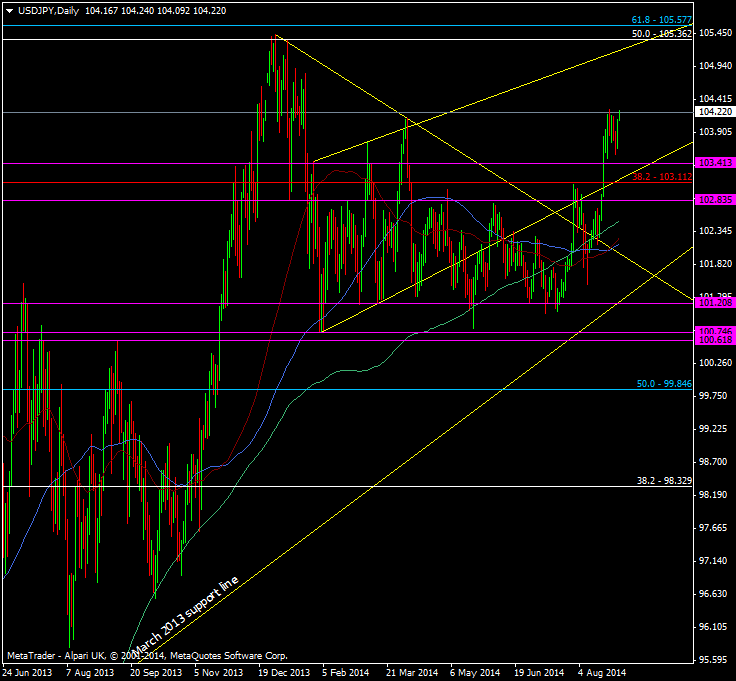
USD/JPY Daily chart 01 09 2014
The interesting levels are up at 105.36/58 and the two long term fibs from 2002 and 2007. According to my charts the 2002 50 fib was broken by 7 odd pips back in Jan but with such long term indicators 7 pips isn’t much to call it a proper break, so I’ll be looking for it to hold some resistance, as will 105.58. I wouldn’t necessarily look at the level to go short in this current bullish environment but it’s worth keeping an eye on to see if some use it to take some profits off the table.

