
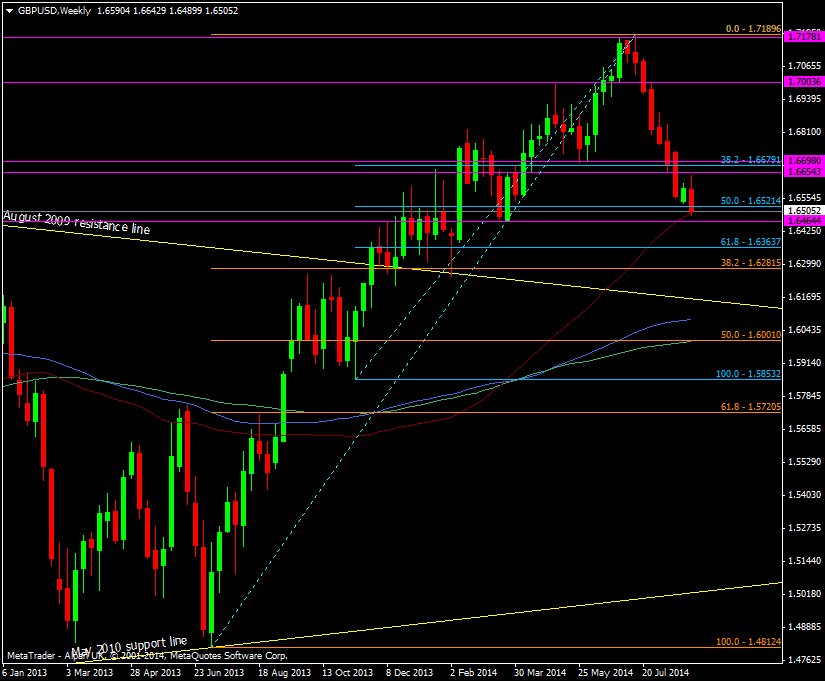
We’ve marched through the 50 fib of the Nov 2013 swing up and traded a few pips below the 55 wma at 1.6498. As Greg has noted the March low at 1.6464 is a level to watch but the whole area around 1.6460/80 is worth noting.
GBP/USD Weekly chart 02 09 2014
Seeing over a 700 pip fall since July is getting my buy finger itching for action but I don’t think I’m ready to fight this trend just yet. There may be some reward from buying here, if we hold 1.65, but I’d look to keep it very tight with a stop just under 1.6460 level, as after that it could be a quick trip down to 1.6360 and the 61.8 fib.

