
The USDCAD has been able to stay below the previously defined “line in the sand” at the 1.0900-06 area (see prior post at https://www.forexlive.com/blog/2014/09/03/usdcad-moves/) and this has given the sellers more confidence. The subsequent selling has led to another push and close below the 100 hour MA (blue line in the chart below) at the 1.0881. This level can now be a close risk defining area for shorts. Stay below and the shorts remain in firm control. Move above and there may be some disappointment and short covering. The USDCAD can be a flaky currency pair.

USDCAD trades below the 100 hour MA at 1.0881. Now risk defining level.
Until then however, the next target on the downside comes in at the 1.08578-601 which represents the 100 day MA (at 1.08578) and the 61.8 % of the move up from last weeks low. Monday’s lows are also in this area.
Looking at the daily chart, the low from last week bounced – like a ball – off of the 50% of the move up from the July 2014 low to the August 2014 high (at 1.0808). The quick rebound – after the break away from the 100 day MA – showed that buyers were anxiously waiting for the opportunity to buy against the dip. If the price is able to get below the 100 day MA and move back toward this 50% level, I would expect to see the buyers use the level again – with stops below.
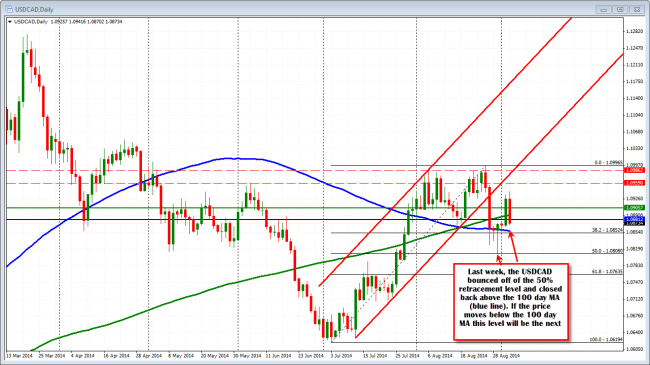
USDCAD daily chart shows support at 100 day MA and 50% retracement
First things first for the sellers is to get to and stay below the 100 day MA. Then the 50% level can become the next talking point.

