
A forex client asked to apply my disciplined way of analyzing forex charts to the the S&P, Nasdaq and Dow indices. I will take a look at the SPX Index, and define risk using the technical tools and also outline some targets to the upside.
The price of the S&P Index has obviously been trending higher going back to the end of 2012 (or that was the last time the price traded below the 50, 100 and 200 day MAs). Since December 27 2012, the price of the SPX has closed below the 100 day MA only 15 times. That is not a lot. As mentioned the price has not traded below the 200 day MAsince November 21, 2012 to be exact.
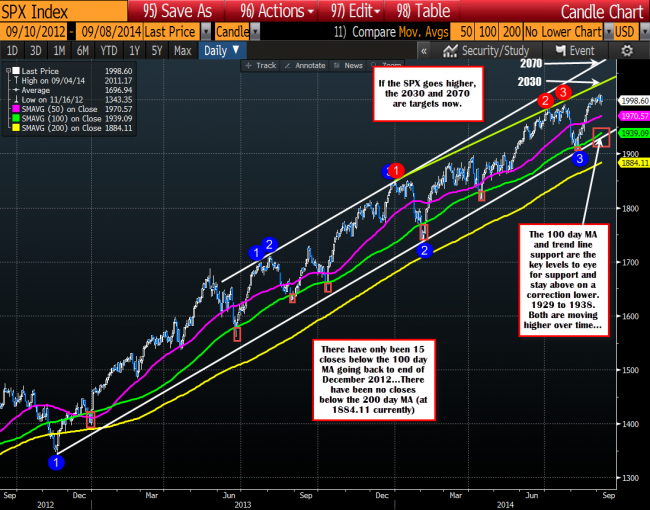
SPX daily chart has the next target at 2030 and then 2070. Support at 1970.57 (50 day MA ) and 1929/39 (trend line and 100 day MA)
I use the 50 day MA in equities because equities will rally over time (barring disasters) due to demographics, inflation (even 2%), increased productivity, and other factors that tend to support stocks. As a result, I need a quicker MA at times. The current 100 day MA is at 1939.09 – around 60 S&P points away. The 50 day MA is at 1970 – or 28 points away.
A move below the 50 day MA occurs more often (see purplish line). Since the end of December 2012, the price has closed below the line 57 times. ON most of the breaks, there is a reaction lower. So traders tend to follow it.
Looking at the current chart the 50 day MA is at 1970.57 today. Looking at the daily chart this is the first risk defining level.
The 100 day MA at 1939.09 and trend line support at 1929 is the second risk area. If there is a correction in the S&P this support area would likely catch the attention of traders. Stay above, and the bulls remain in control. Move below and something is up….The bears start to take back more control. Remember, there have only been 15 days where the price closed below the 100 day MA going back to the end of 2012.
The 200 day MA is at 1884. Any move below the 200 day MA would signal more downside potential for the S&P. A move below, would be the 1st close below the MA since the end of December 2012.
What about the upside? What targets are above?
Trading at all time high levels, there is little from the past to latch onto as resistance/a target. However, topside trend lines from connecting highs come in at 2030 area and 2070 (the white line is channel trend line resistance). These represent the next major targets for the SPX.
Looking at the hourly chart, the momentum is fading in the SPX ( the 50 our MA is flat now) but is finding support against the 100 hour MA (see red boxes). The price also broke above the July 24 high and found support against the area last week at 1990-91.
This 1990-91 level is now close support with a move below (and staying below) targeting the 1970 level (38.2% retracement). Remember the 1970 area, is also where the 50 day MA is found. So I would expect the market to be focused on the level on a bigger correction.
Right now, the ability to hold the 100 hour MA today and the 1990-1991 level is keeping the buyers in control for the SPX . Momentum may be slowing, but the buyers remain in control. If the price is going to go lower, a move below these levels is the minimum prerequisite.
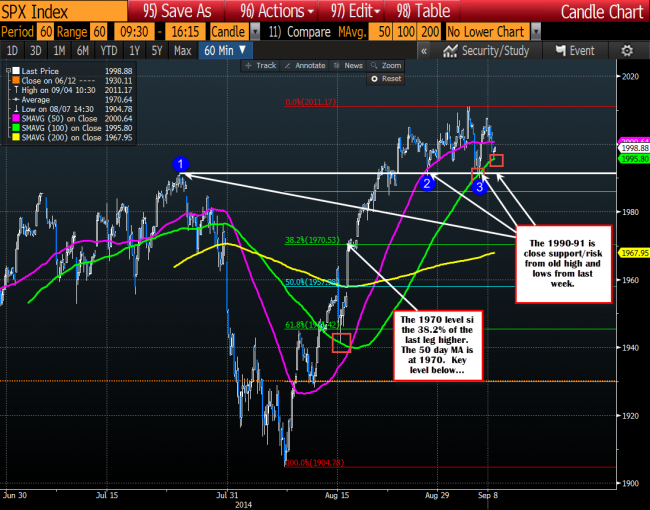
The SPX index is losing momentum but stays above the 100 hour MA at 1995.80 currently.

